

Before we start, I need you to know that I do compiler tests and my tests cover various compilers, but most of my time is spent in .NET.
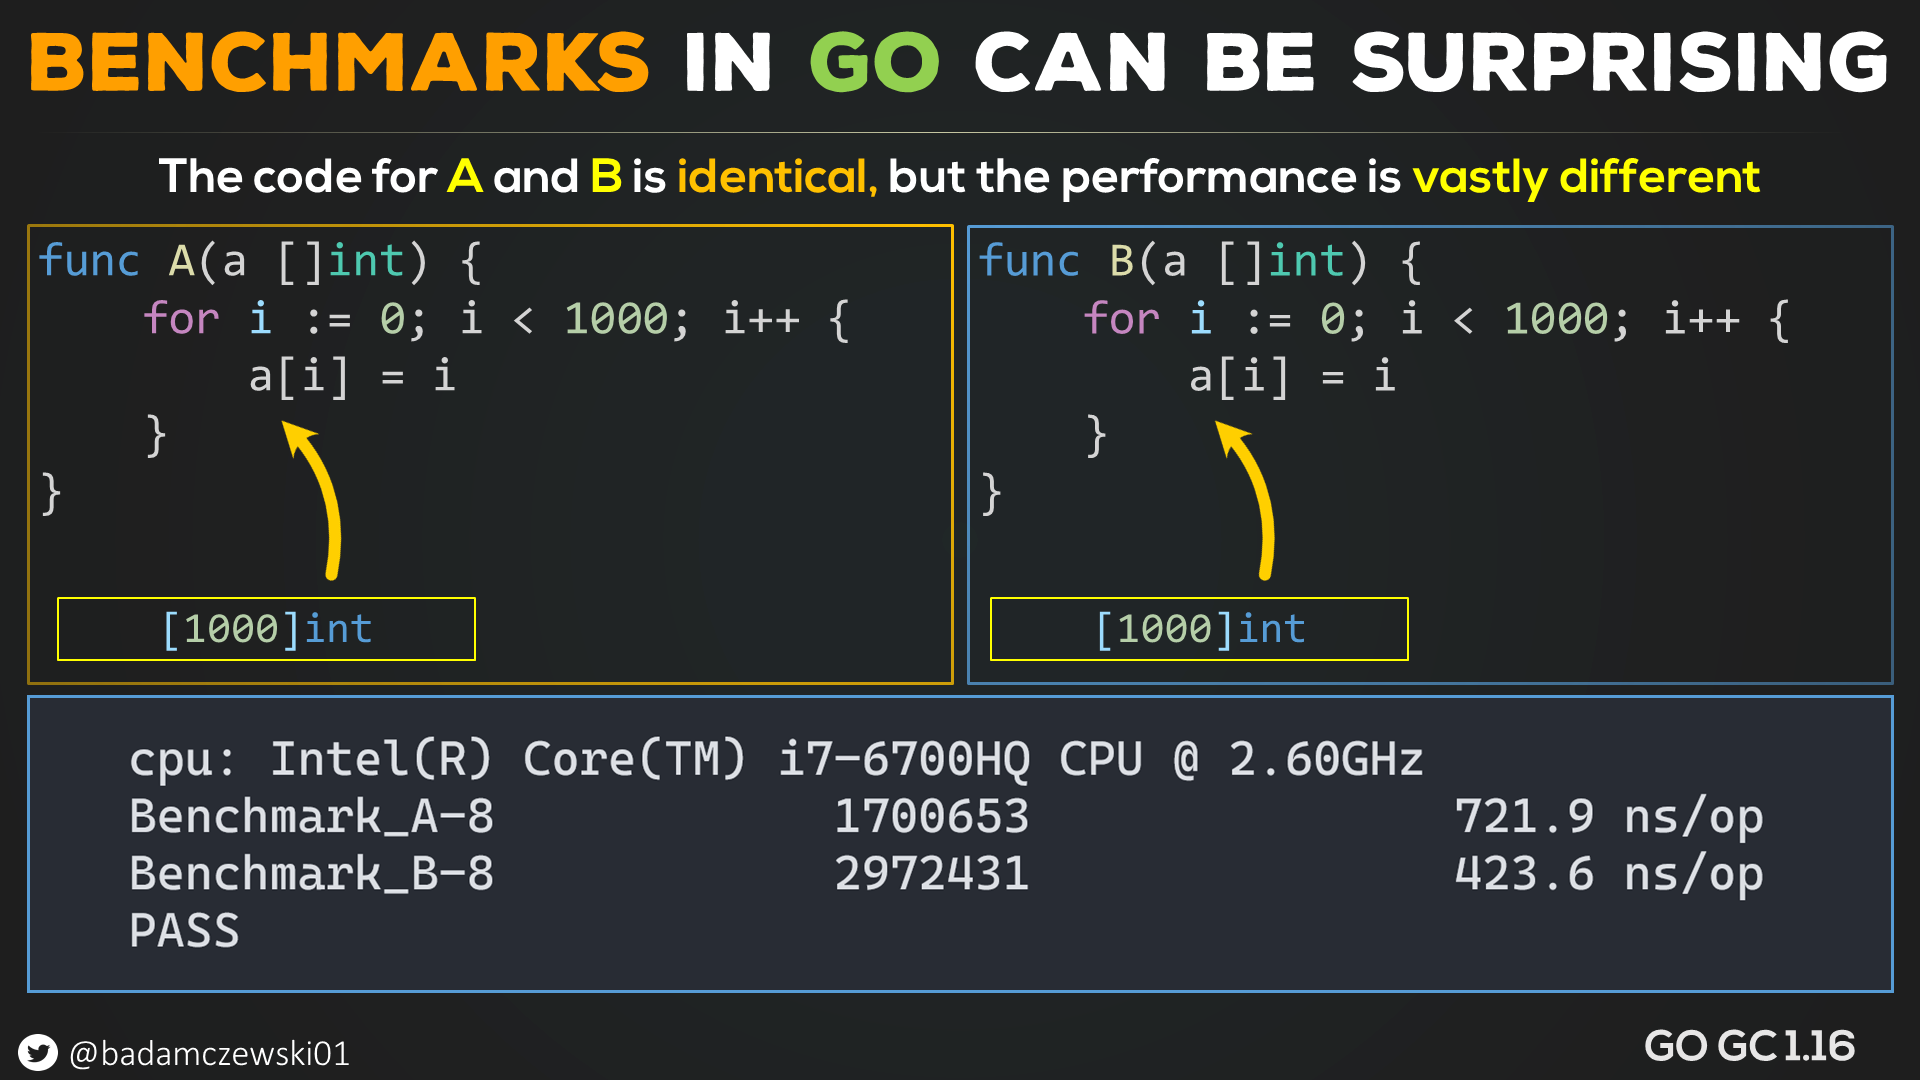
So the other day, I was doing some benchmarks in GO and, by accident, left the same method in two test cases.
Same method two different performance results, how can this be?
Fasten your seatbelts; we're going on a ride.
That might be some mistake with the benchmark setup, but if we change the order of methods, the performance is now reversed.
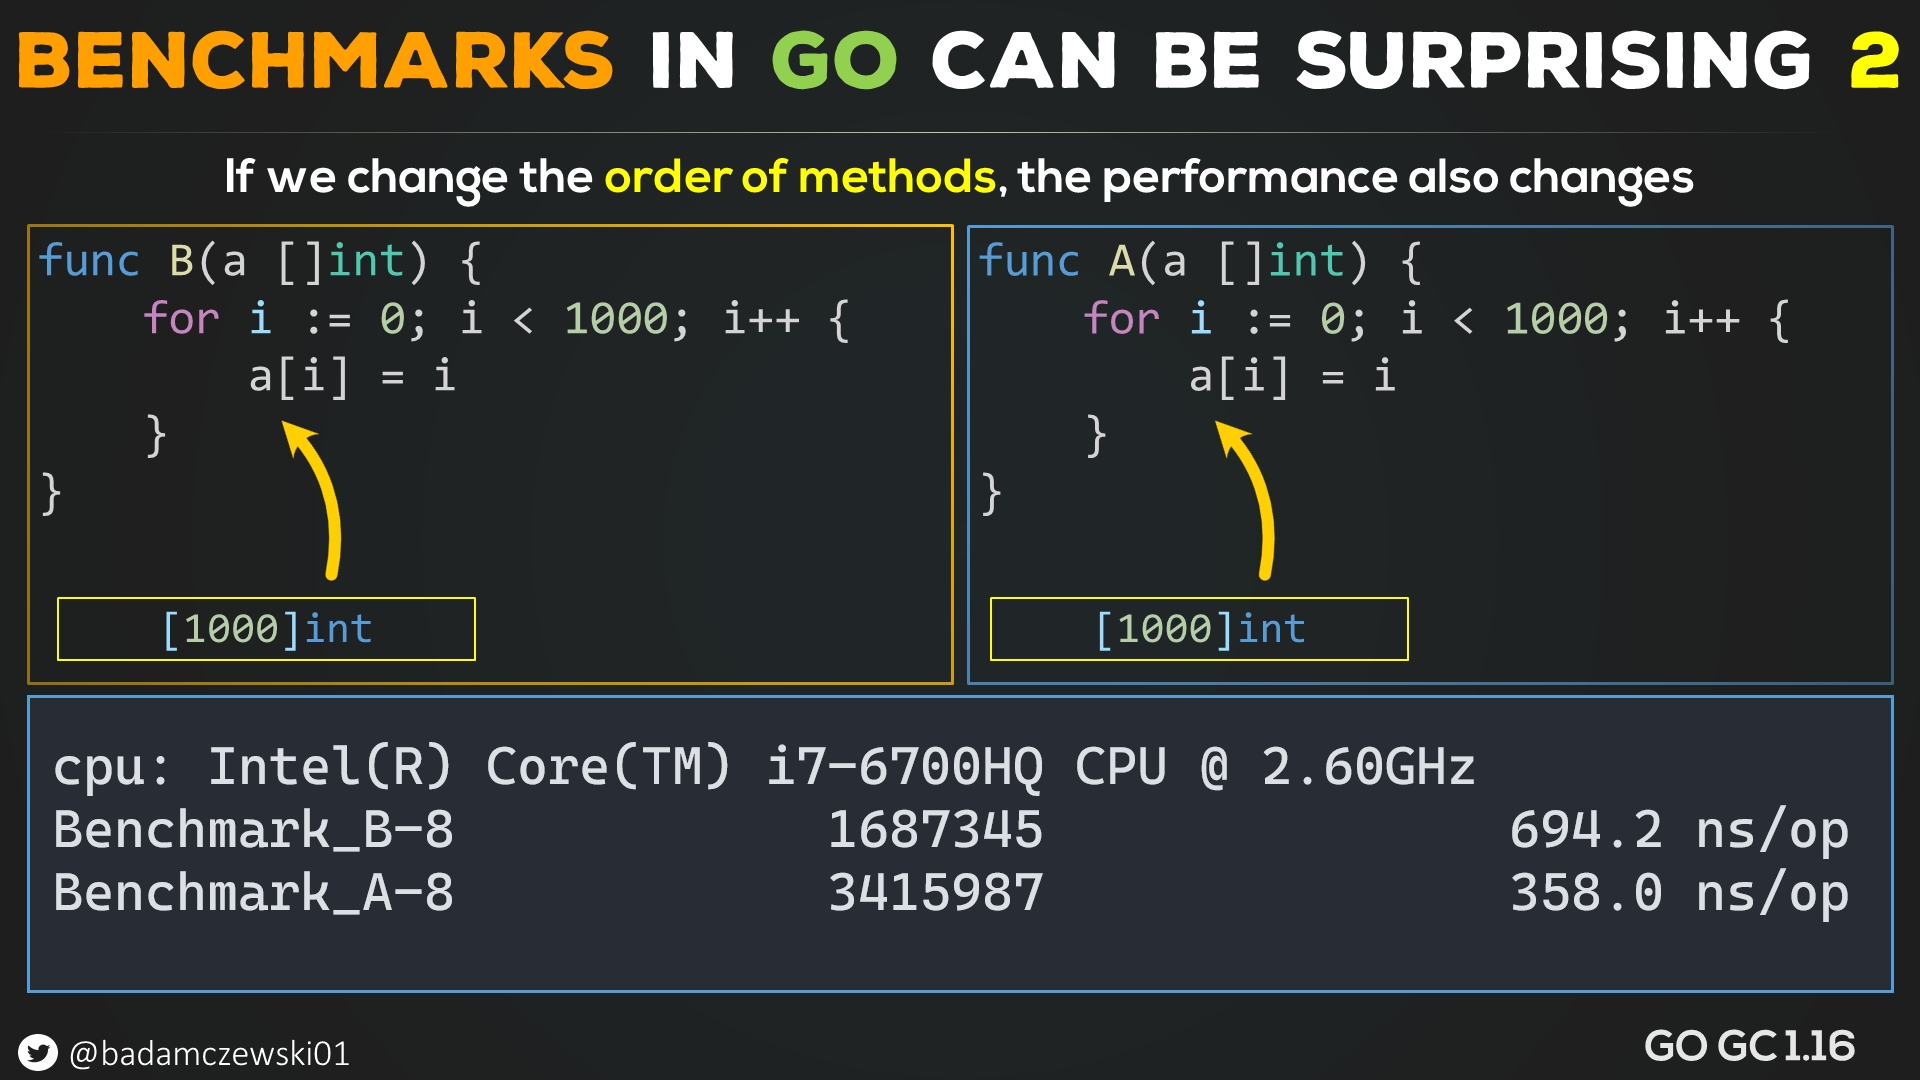
Perhaps I made some mistake here? That looks like an error on my part (it's not).
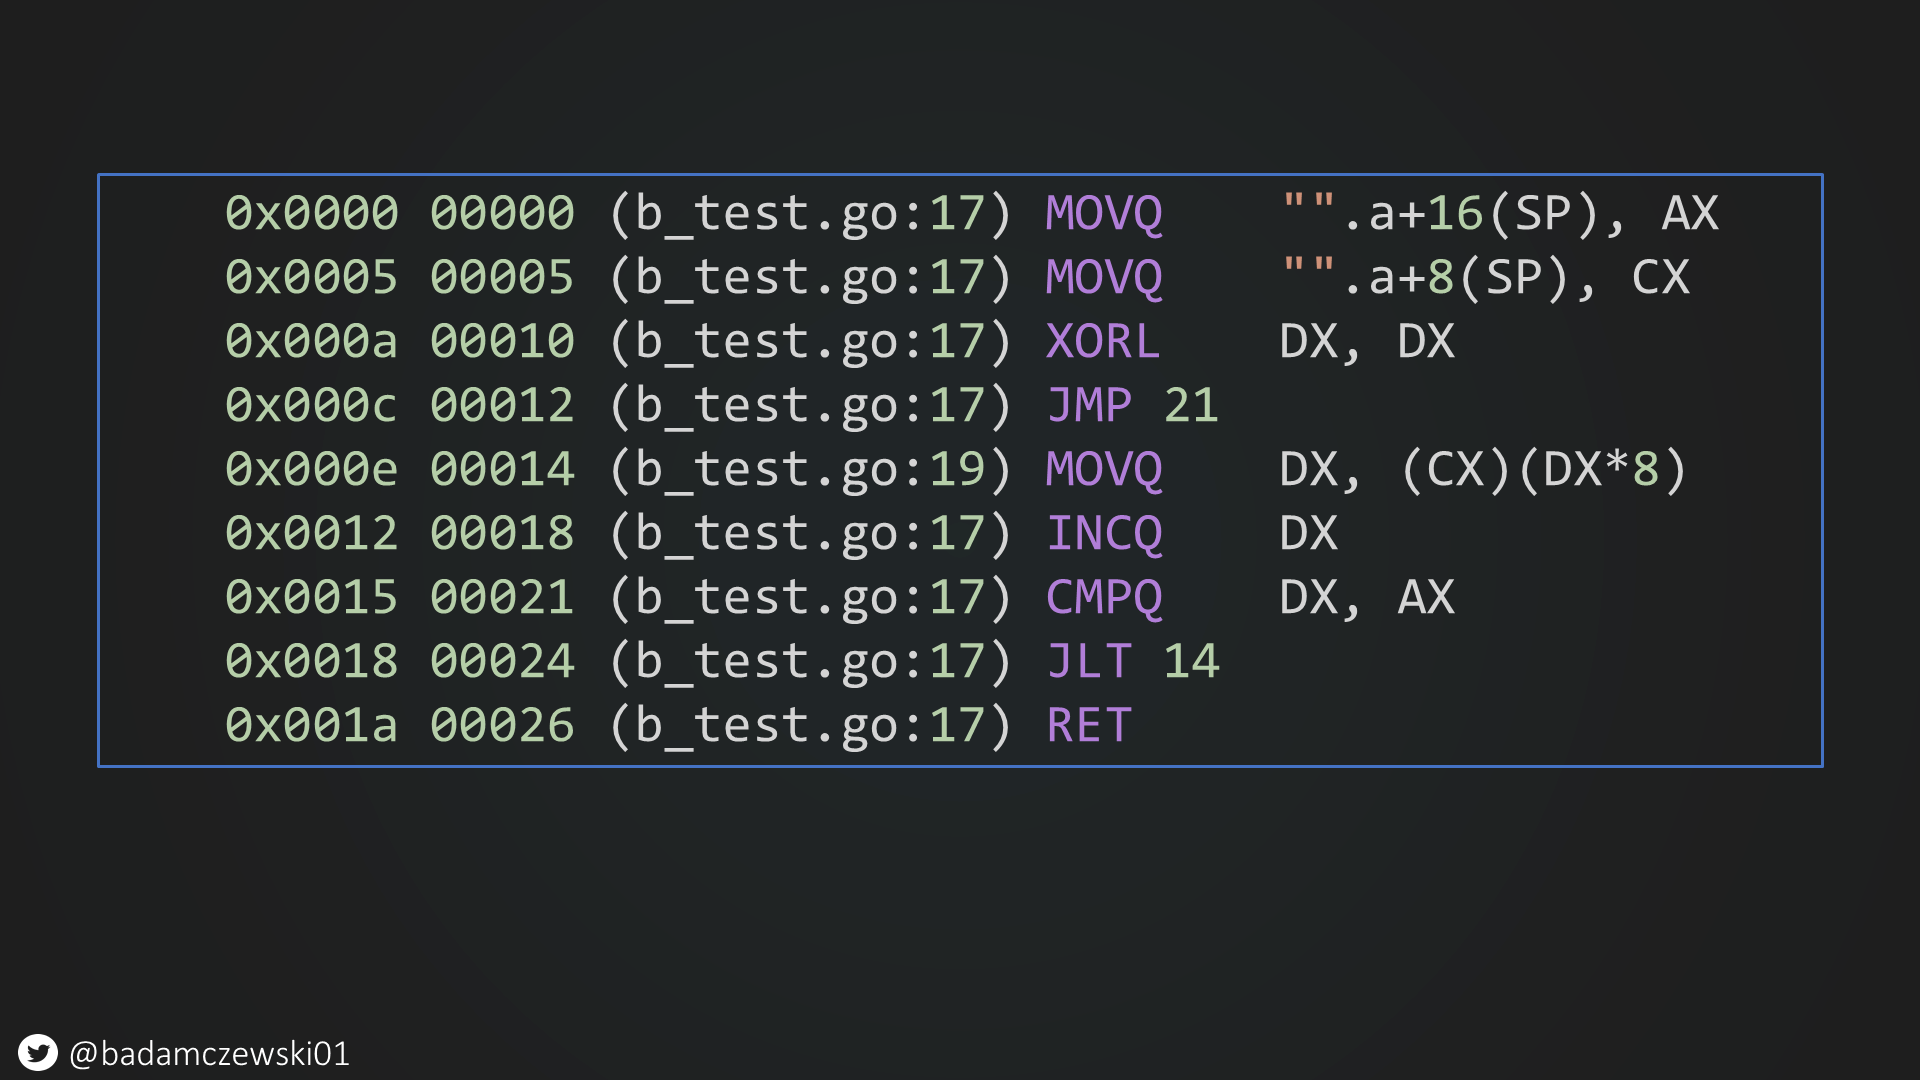
When we decompile this code, we see that it uses a single register to handle the entire loop and emits a bounds checking branch.
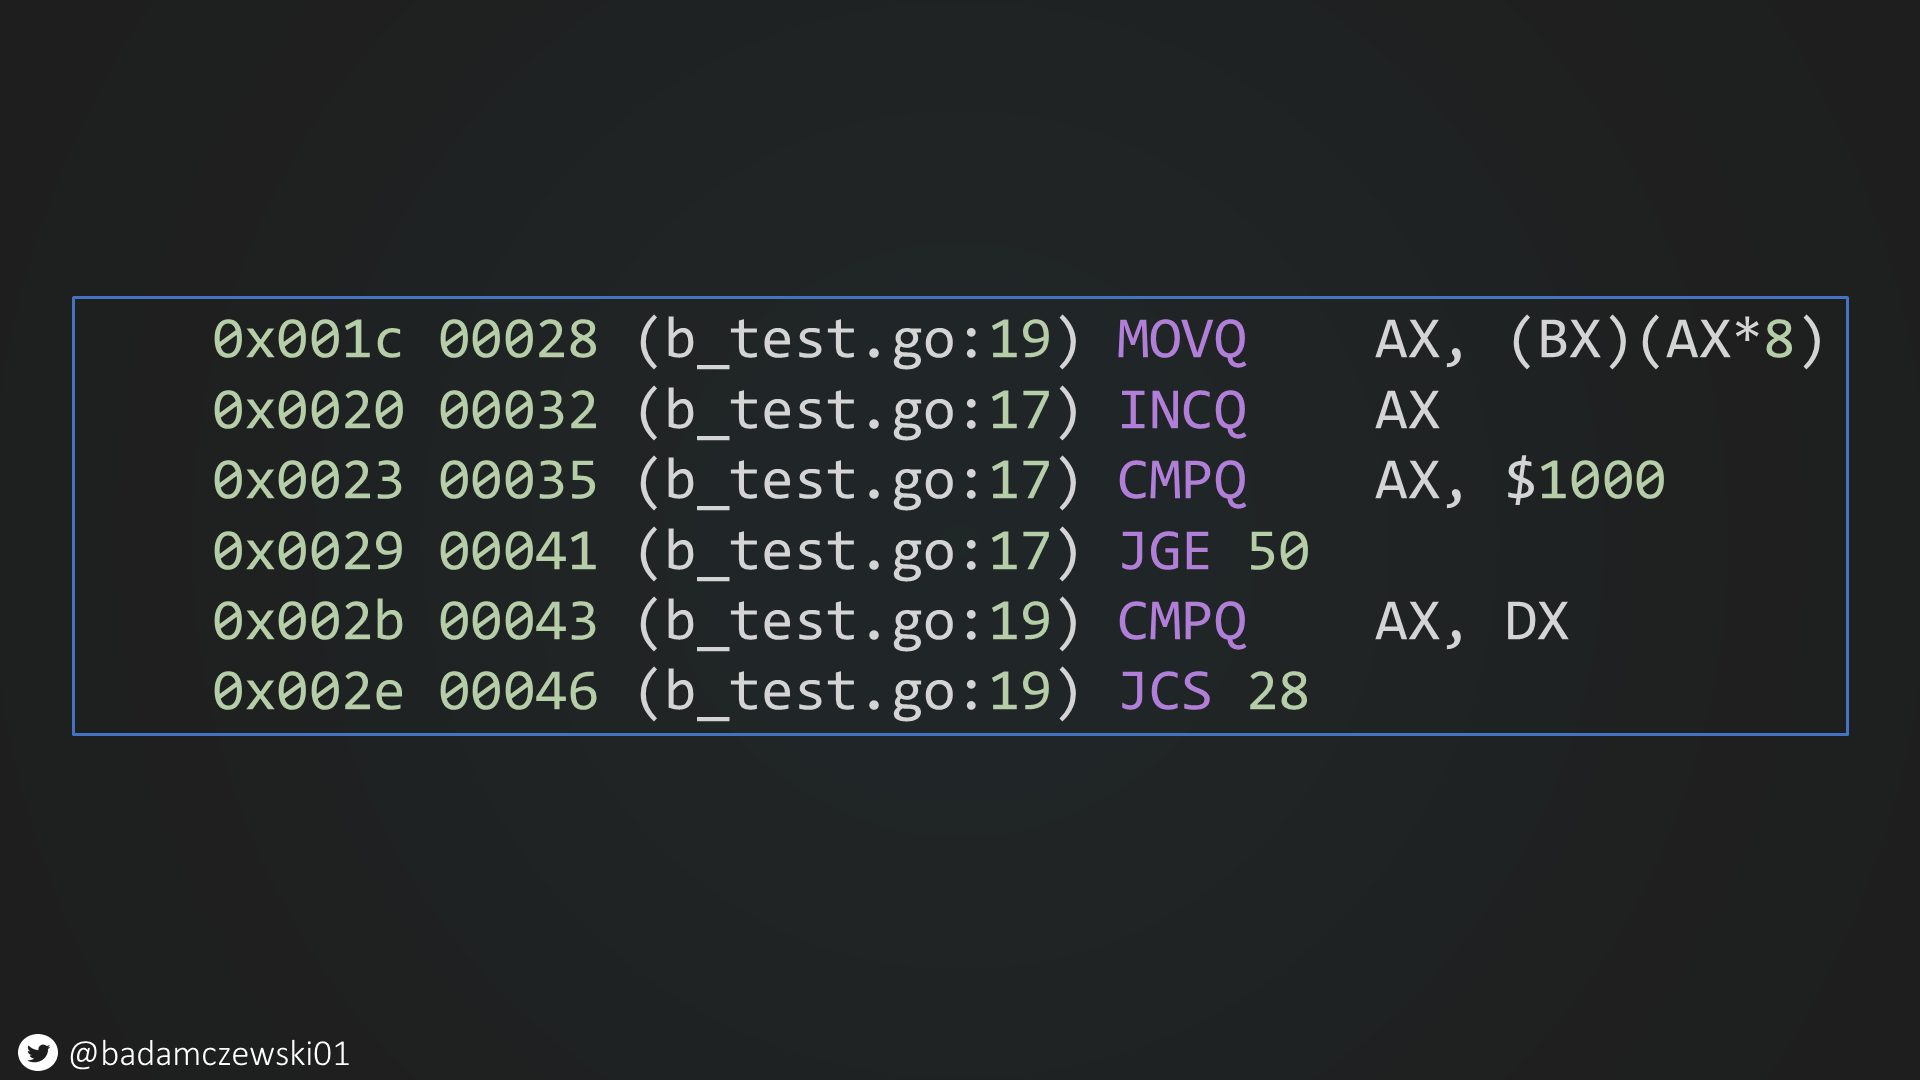
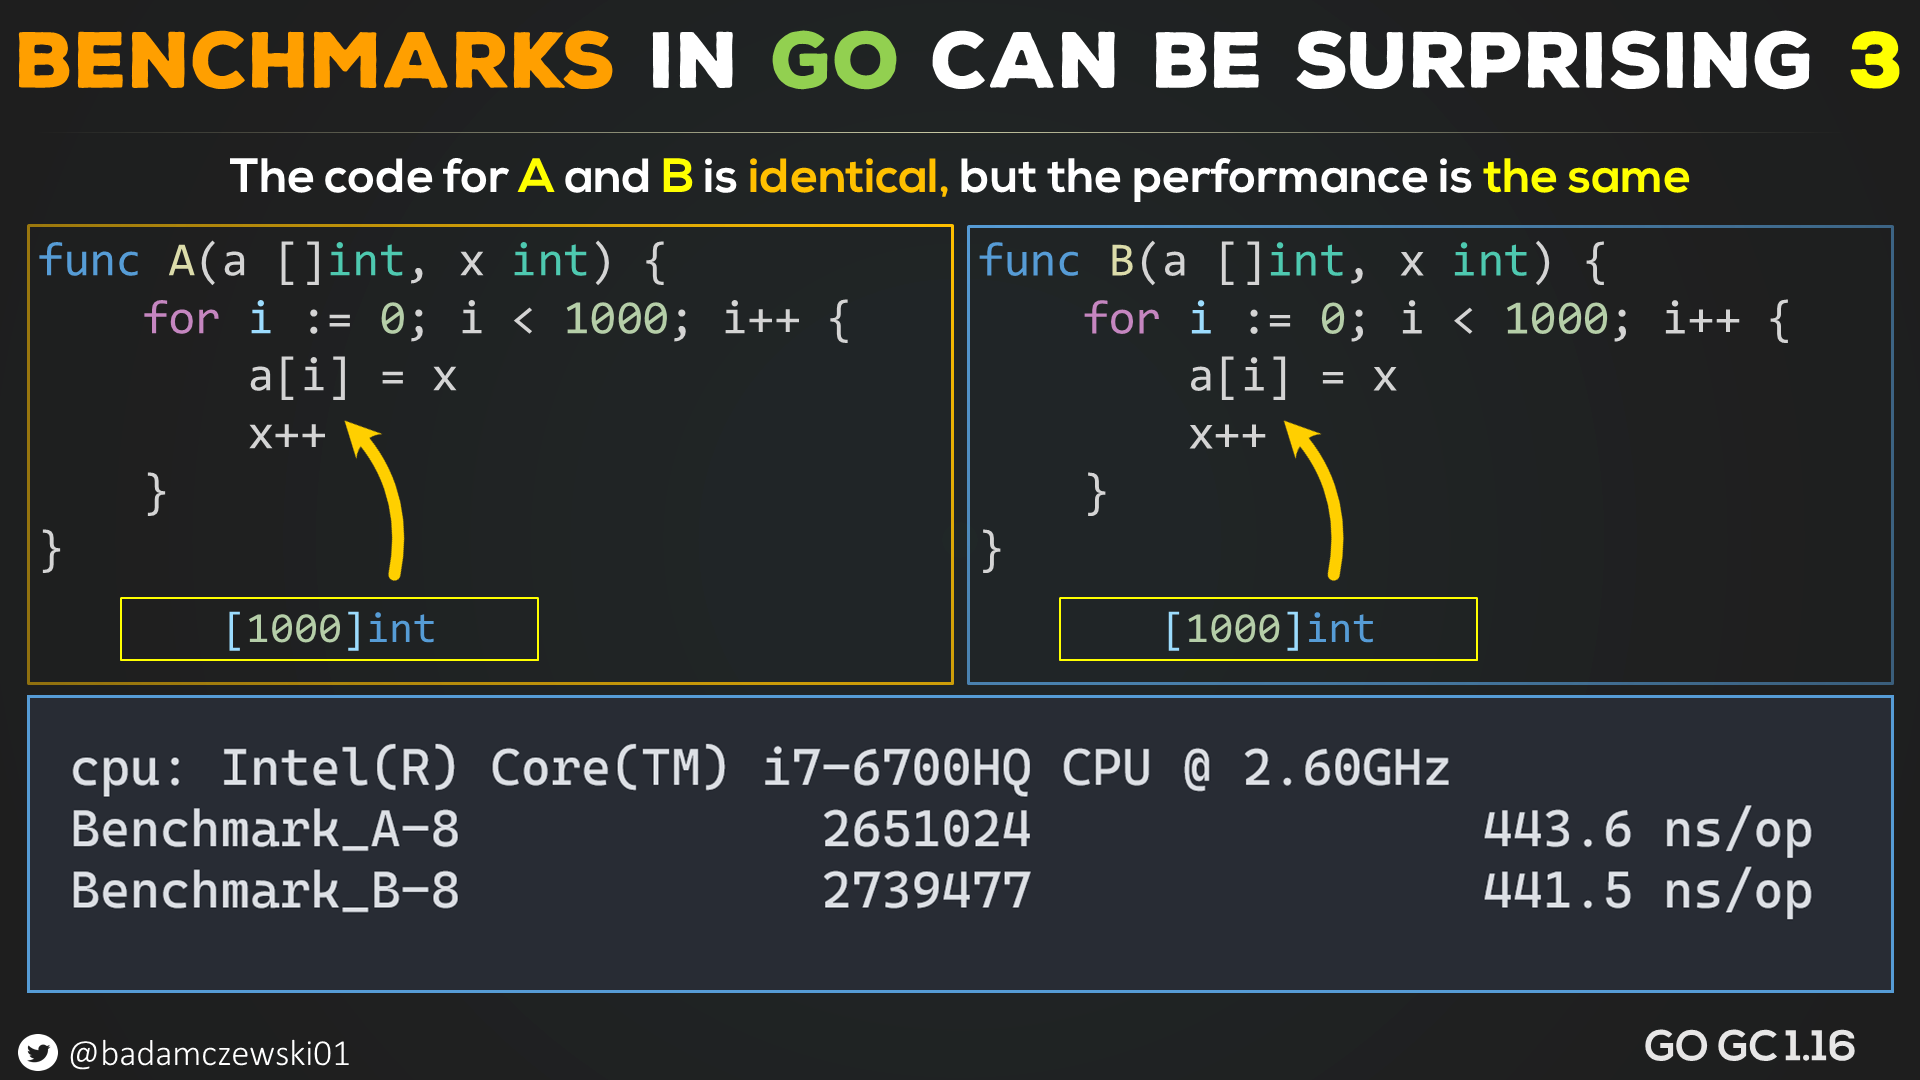
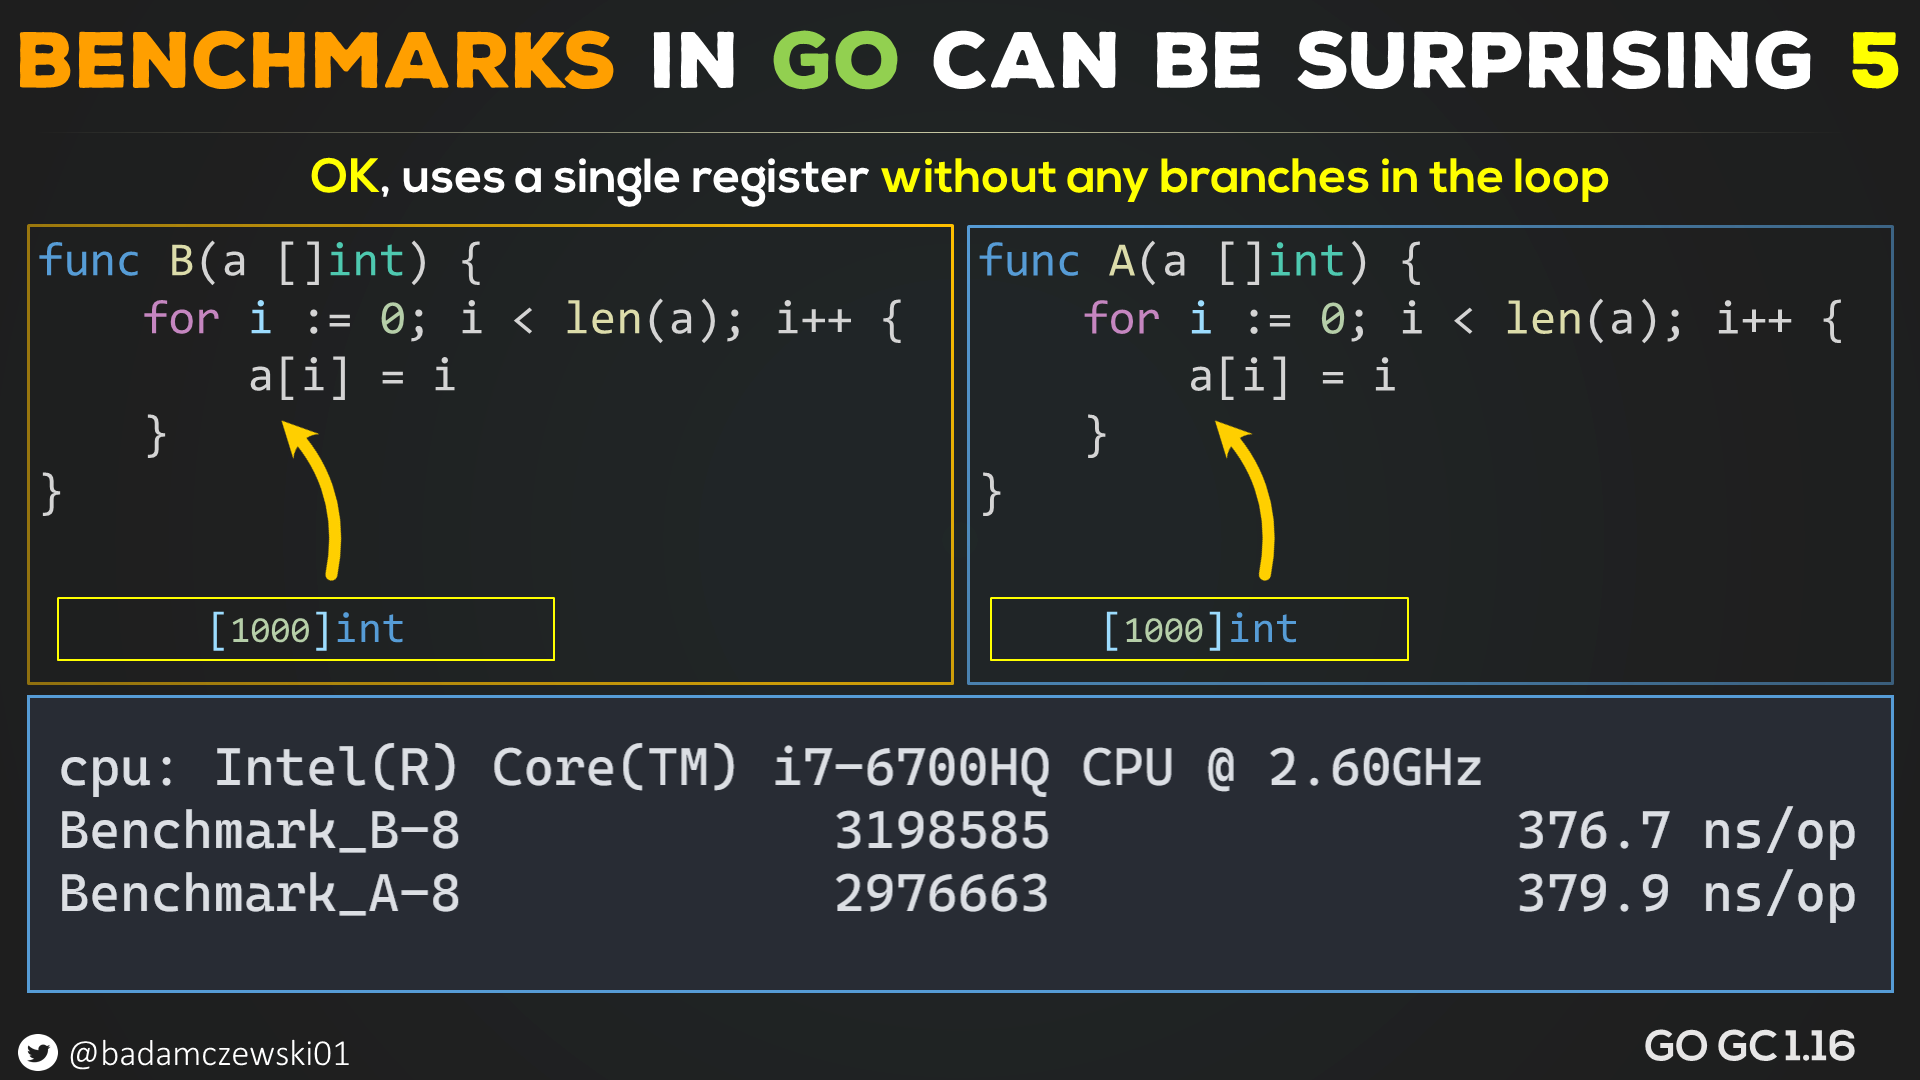
Nothing seems to be suspicious yet (it is, pay attention to this asm code). So let's modify the code such that it uses more than a single register (in other words; let's force it to do something else in the loop)
And now we have identical performance. This code uses an extra register for "x."
So what happens here? To have this bizarre effect, we need a branch inside the loop and a single register.
Before we move on let's see what happens if we increase the loop size.
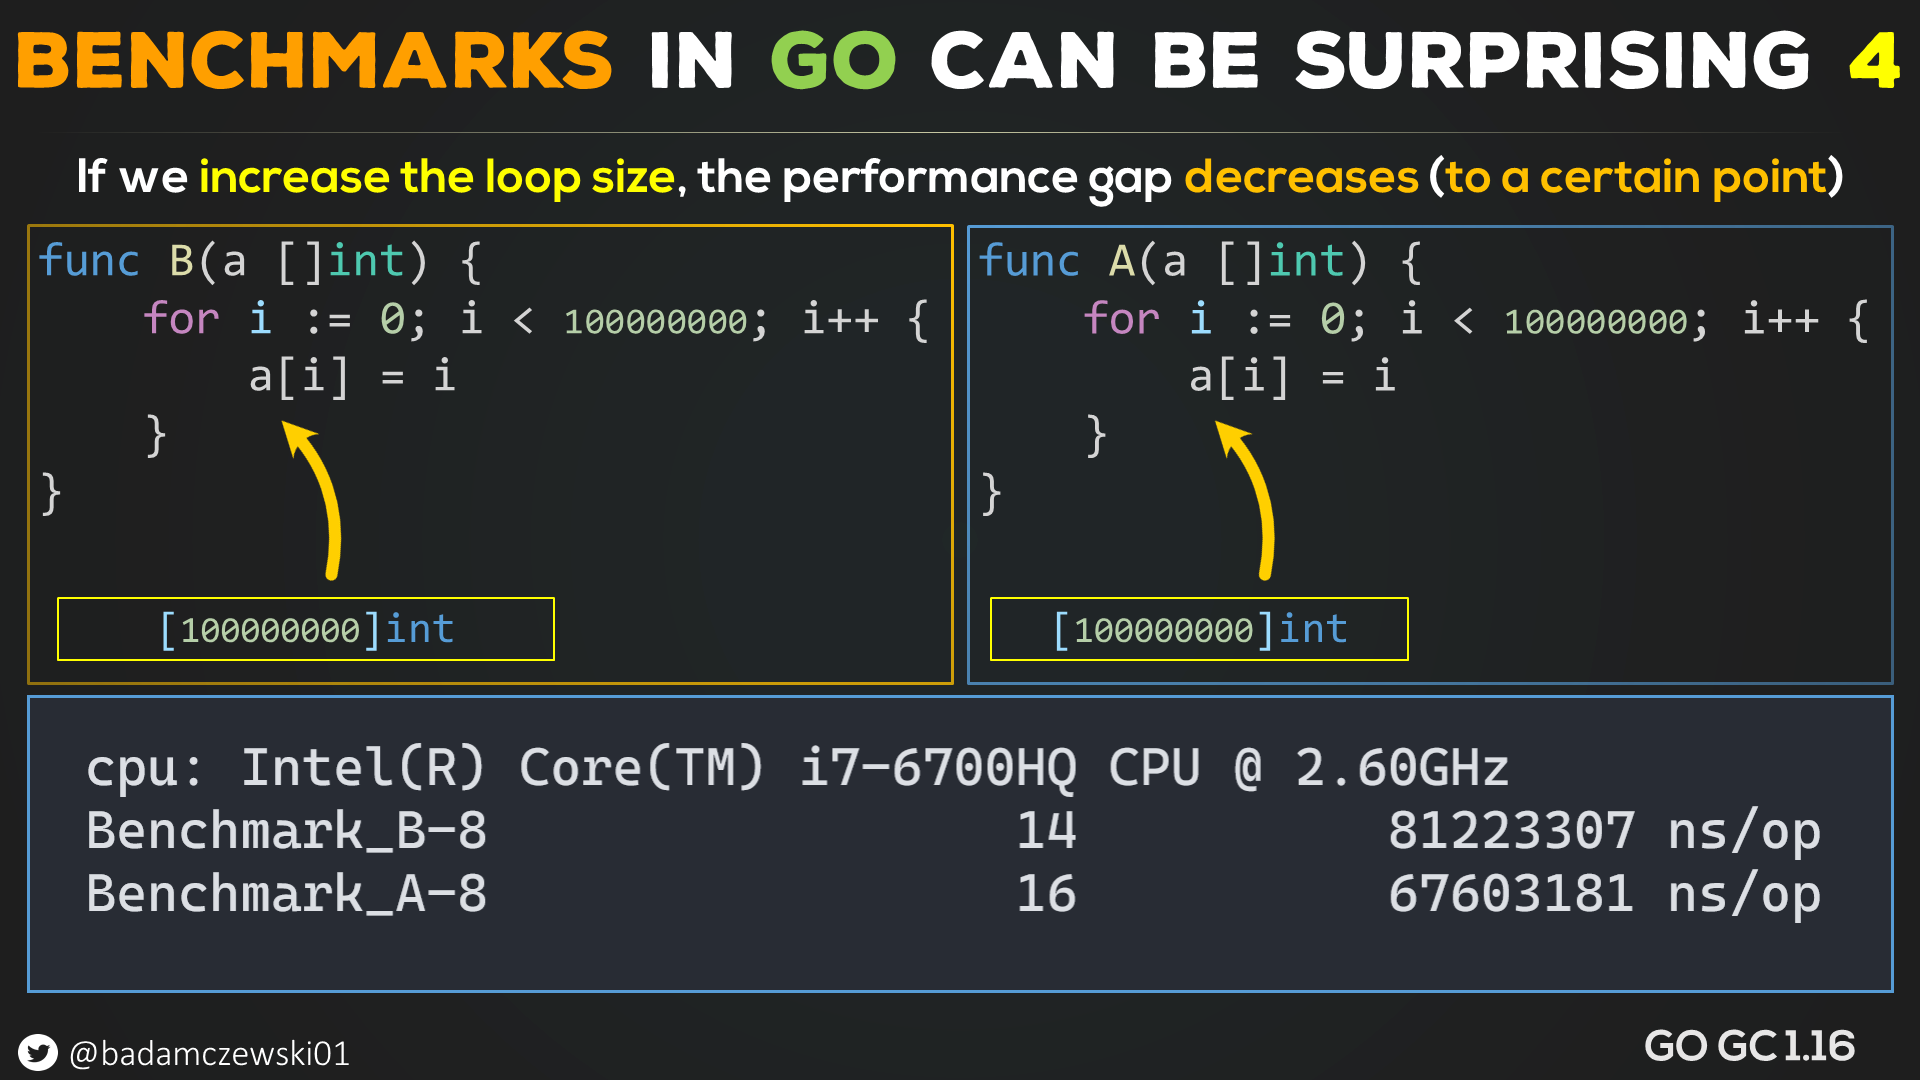
As you can see, it got better but only to a certain point. If we switch to code that uses a single register and the bounds check branch is removed in the loop, it's all good.
So now we know that we need a branch in the loop to trigger this *or* to minimize this effect, we need to use multiple registers and have a branch.
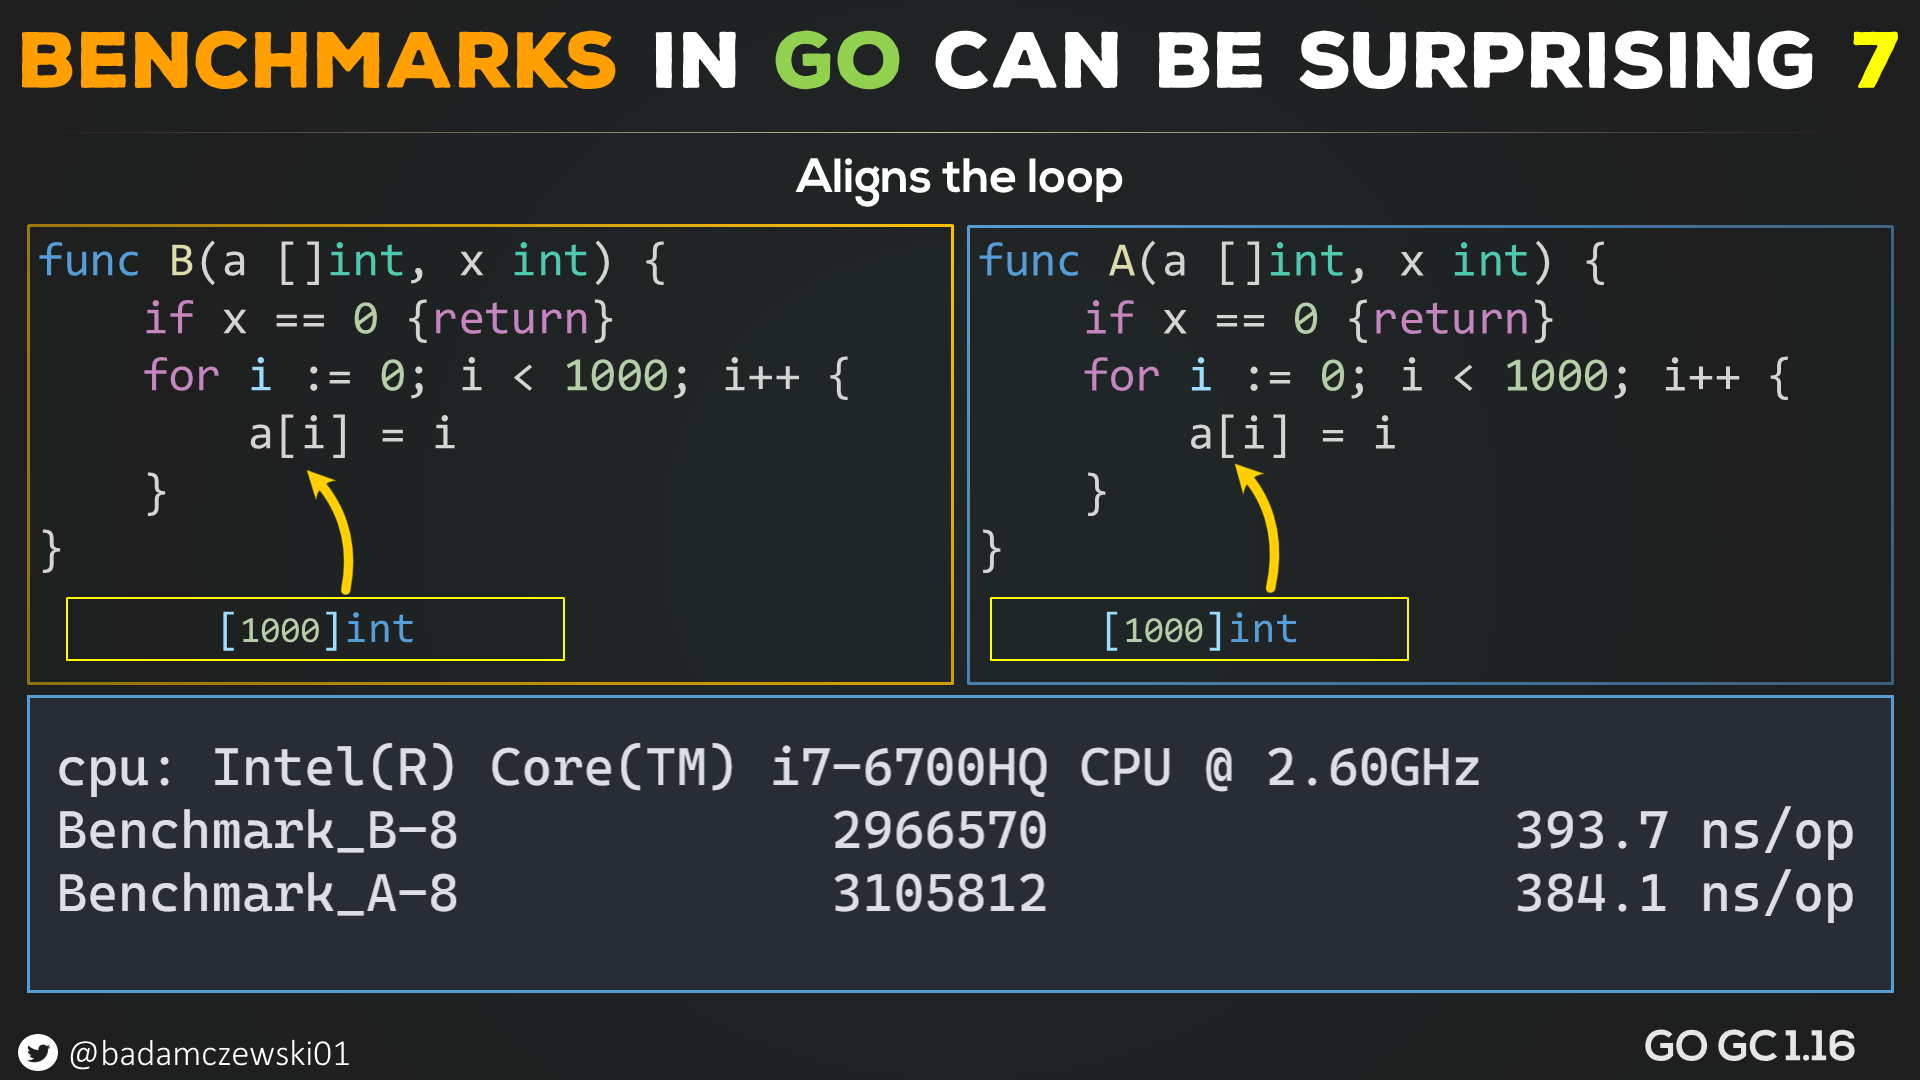
But is this true? Let's have a simple no bounds check loop and introduce an external branch:

Oops, broken again ...
So what's the cause? Let's look at the first test case that has started this investigation and the generated code.

If you look closely, you will in fact see that the loop code is misaligned. Since most CPUs have 64-byte cache lines a propper loop alignment means that loop entry should be aligned to a 32-byte boundary. This will allow the CPU to fetch loop instructions more efficiently.
This has caught me by surprise since on all of the other examples when I've generated the native assembly output; the GO compiler tried to align loops by putting NOP instructions. Still, it seems that it was aligning something else, or it simply failed to do so for this example.
So if we have two methods in the same code base, one will be misaligned while the other can end up aligned or partially aligned, making the order in code the determining factor in terms of performance.
(I would like to thank Alex Blewitt for suggesting loop alignment)
If we move the loop to its own cache line, both methods have near-identical performance.
"Hey Bartosz, I do not see this big of a difference in the first example."
Loop streaming is different per CPU Family, so it might be that the issue is not going to be as big as on Intels; you always need to measure and act accordingly.
Benchmarking is a tricky business, especially since even big loops had this effect, so I can easily make incorrect assumptions by looking at a benchmark.
When this is accidental, then it's fine, but what if I know this and want to trick you and market my framework or product as the fastest on the market? Without knowing how to do benchmarks, you have no choice but to believe me.
How to fix this?
The benchmark package should have a warm-up phase, and each method should be run in another process, and a master program should coordinate the whole operation.
There are packages like that in .NET where branch prediction and other effects are minimized.
GO seems to be lacking such a robust benchmarking package, so I think that if no one is up to the challenge, I will implement it for my own use and then open-source it.
That's all, folks; I hope that you found this article and analysis interesting.

If you liked this article then consider buying me a coffee (it pays the hosting)