
(This article will be split into multiple parts since otherwise it would be too long)
Writing correct benchmarks is hard, and it's a craft.
Benchmarks try to test a piece of code running in isolation which is very hard, and the results will be mainly in milliseconds or even in smaller units of time.
Consider how hard it is to measure such timings correctly and filter out the noise and other system components running at the time that might contribute to the benchmark result.

Performance Testing APIs or Large system features aren't benchmarks (not really), but they fit in a performance test category, at least for me.
Most low-level libraries, compilers, and (sometimes) products will try to promote themselves by showing you benchmarks (and perf tests) and will claim to be X times better than the competition.
(we call it benchmark golf here)
But since benchmarks are soo difficult to write, how can you be sure that those claims are correct?
So today, we shall learn a dark craft of how to lie with benchmarks. Learning to lie with benchmarks will make you more aware of the problems, you will write better benchmarks, and teach other people how to do it better as well.
Let's go:
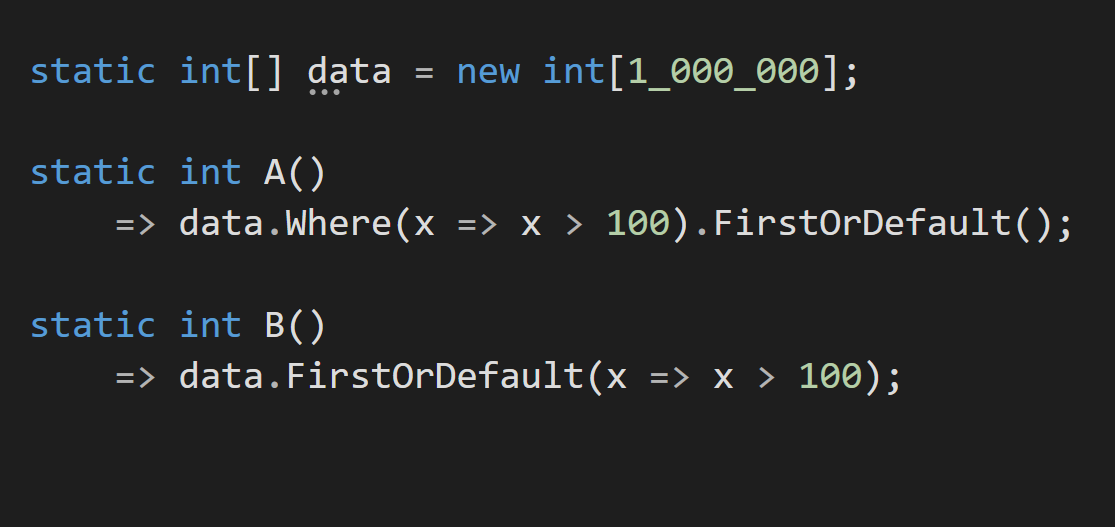
Most of the time, when I have a (heated) performance discussion with people from Reddit, FB, or even Twitter, someone will take my code and will create a "Benchmark" to check if it's valid.
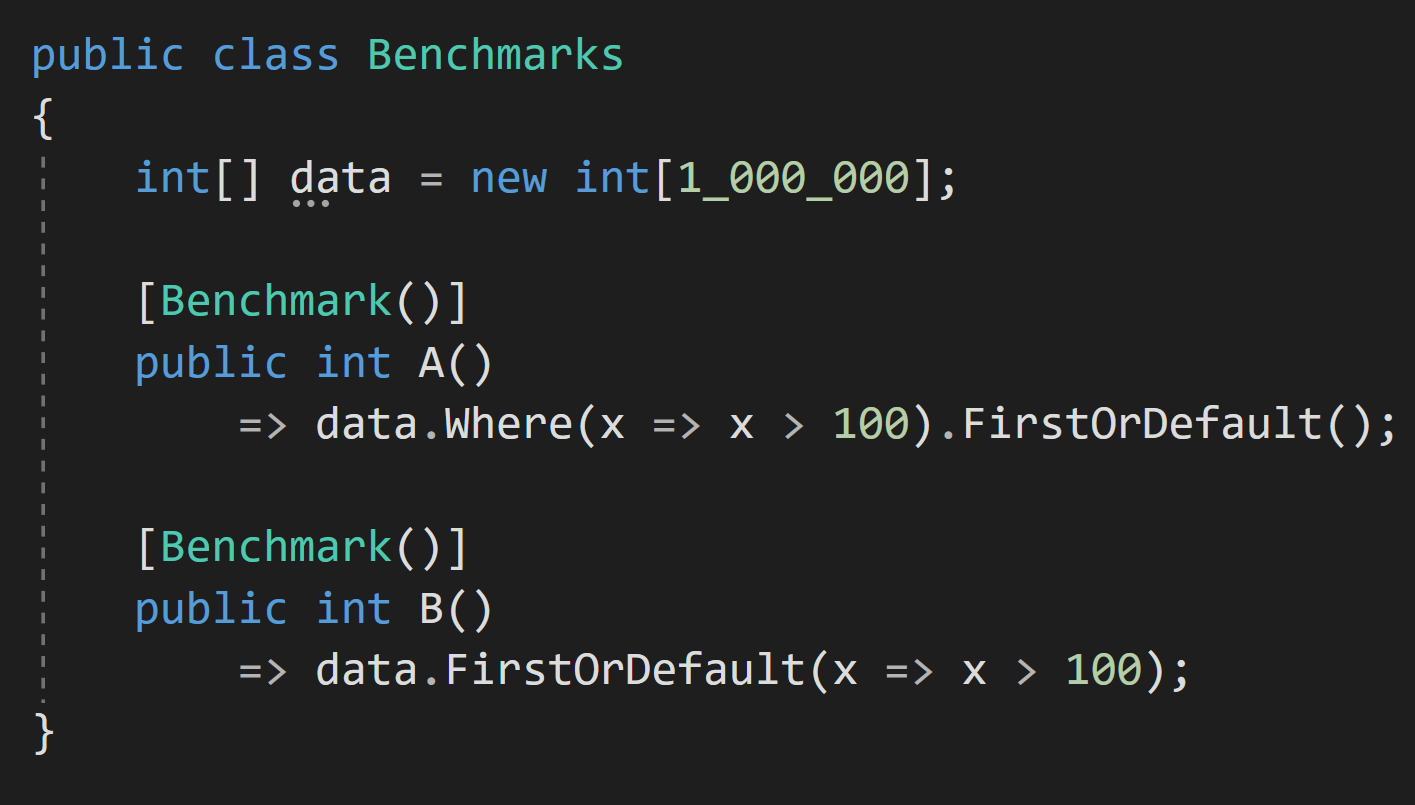
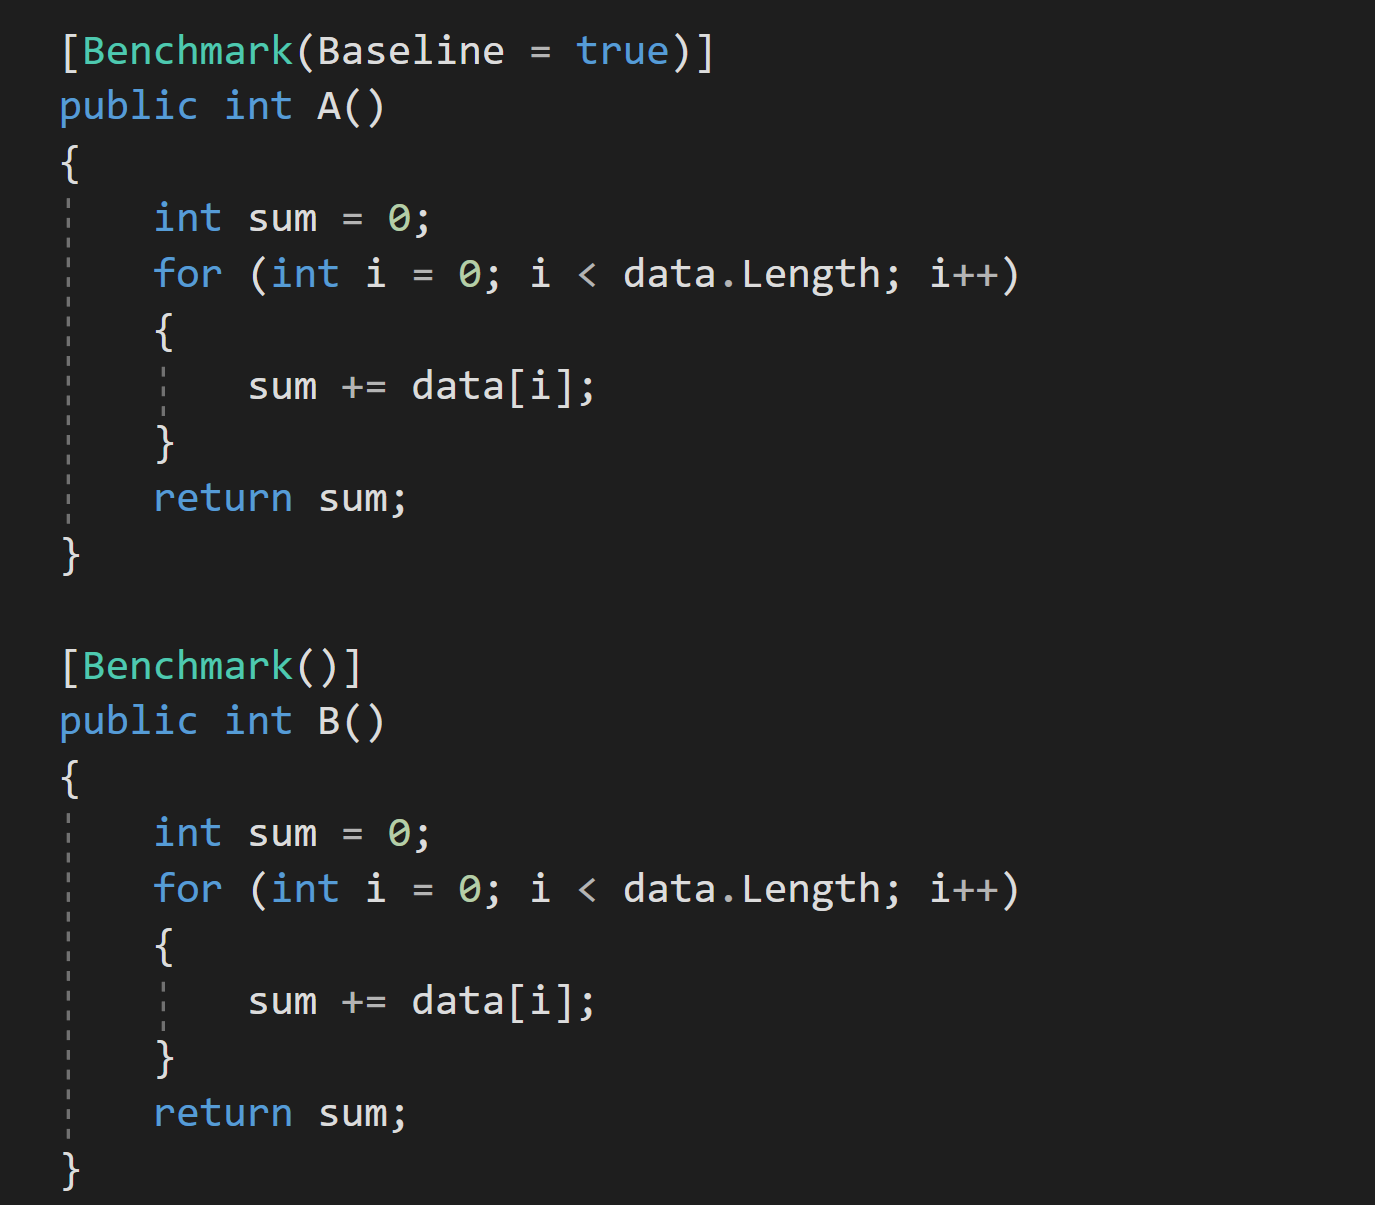
The code will usually look something like this:
And the Benchmark will look something like this:
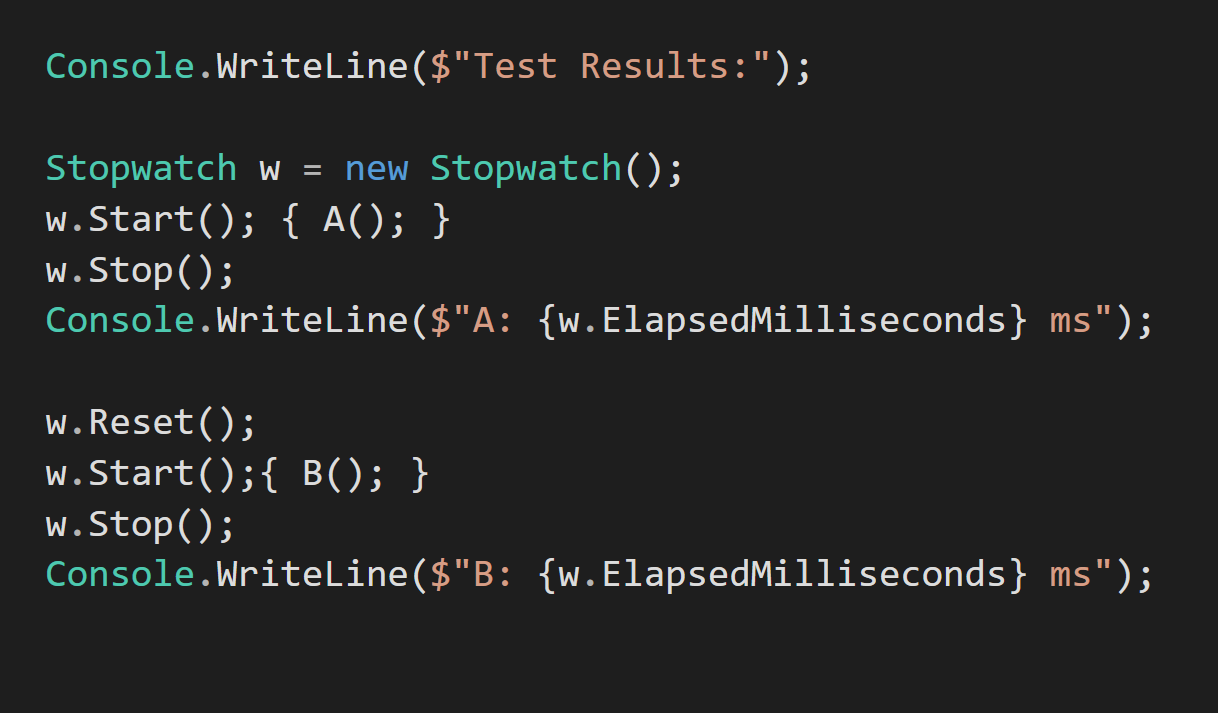
Let's say that I will claim that A is anything from 15 to 50% faster, depending on the context. We then run the code, and it turns out that B is faster or A and B are similar in performance.
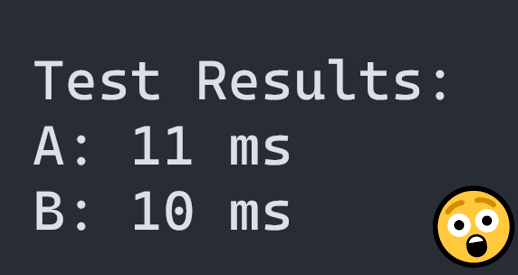
OH NOES.
Is it because I was wrong?
Not really...
This code isn't a benchmark; it's incorrect on multiple levels. To create a proper benchmark, you need to do a couple of things:
- You need to have a warm-up phase. Running one test on a cold cache and the second one on a hot cache is bad; VMs with Garbage Collectors and JIT compilers are even worse since you go through allocation and compilation phases.
- You need to run your code in isolation.
- You need to run your code multiple times to stabilize it and compute statistics like mean, error, standard deviation, etc.
There's more, but these three points are essential.
We had to write our own benchmarks libraries back in the day, but nowadays, it's not needed since most languages have pretty solid benchmark packages.
In .NET there's a pretty good benchmark library called Benchmark.NET, which we can use this to test if our claim if valid (A is faster than B).
Now let's run it:
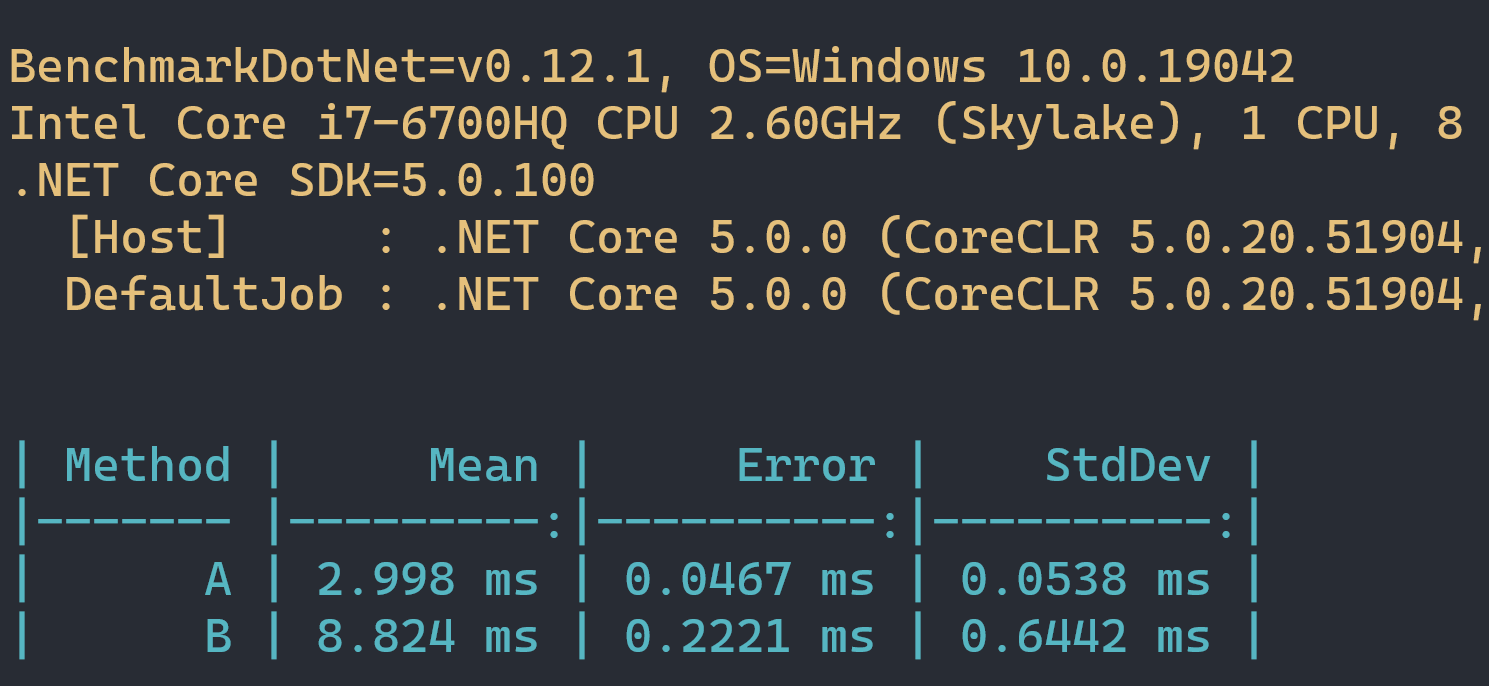
As you can see, when we did a proper benchmark our results are quite different.
Now that we got the basics down, let's see some interesting code that lies to your face:
(We shall be using .NET 5 and the level of crazy will gradually increase with each example)

Lie #1:
Let's look at this code that will add some values based on what value is in each array element:
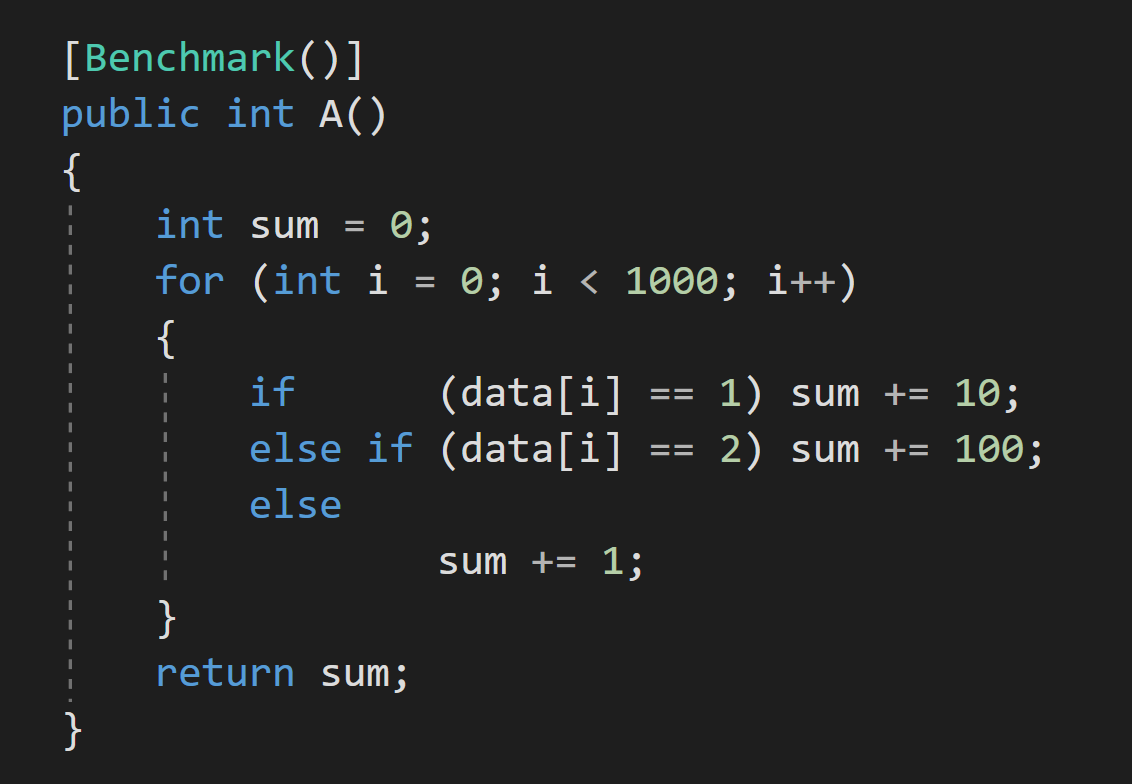
This method has multiple performance characteristics ranging from very fast to very slow, and it's based on data in the array. Depending on what story we want to tell, we can pick one and make our case.
When Data is all zeros:
When Data is all ones:
When Data is all twos:
When Data is all random:
Why so different results?
It's for two reasons:
- Branch prediction is a real thing, and it's pretty important for performance. It's good if branches are predictable.
- JIT compiler treats branches as taken, which means that if-statements are jump-free while code in the else-statement has to issue a jump, so if we have all ones, the code is the fastest since we don't need to do any jumps.
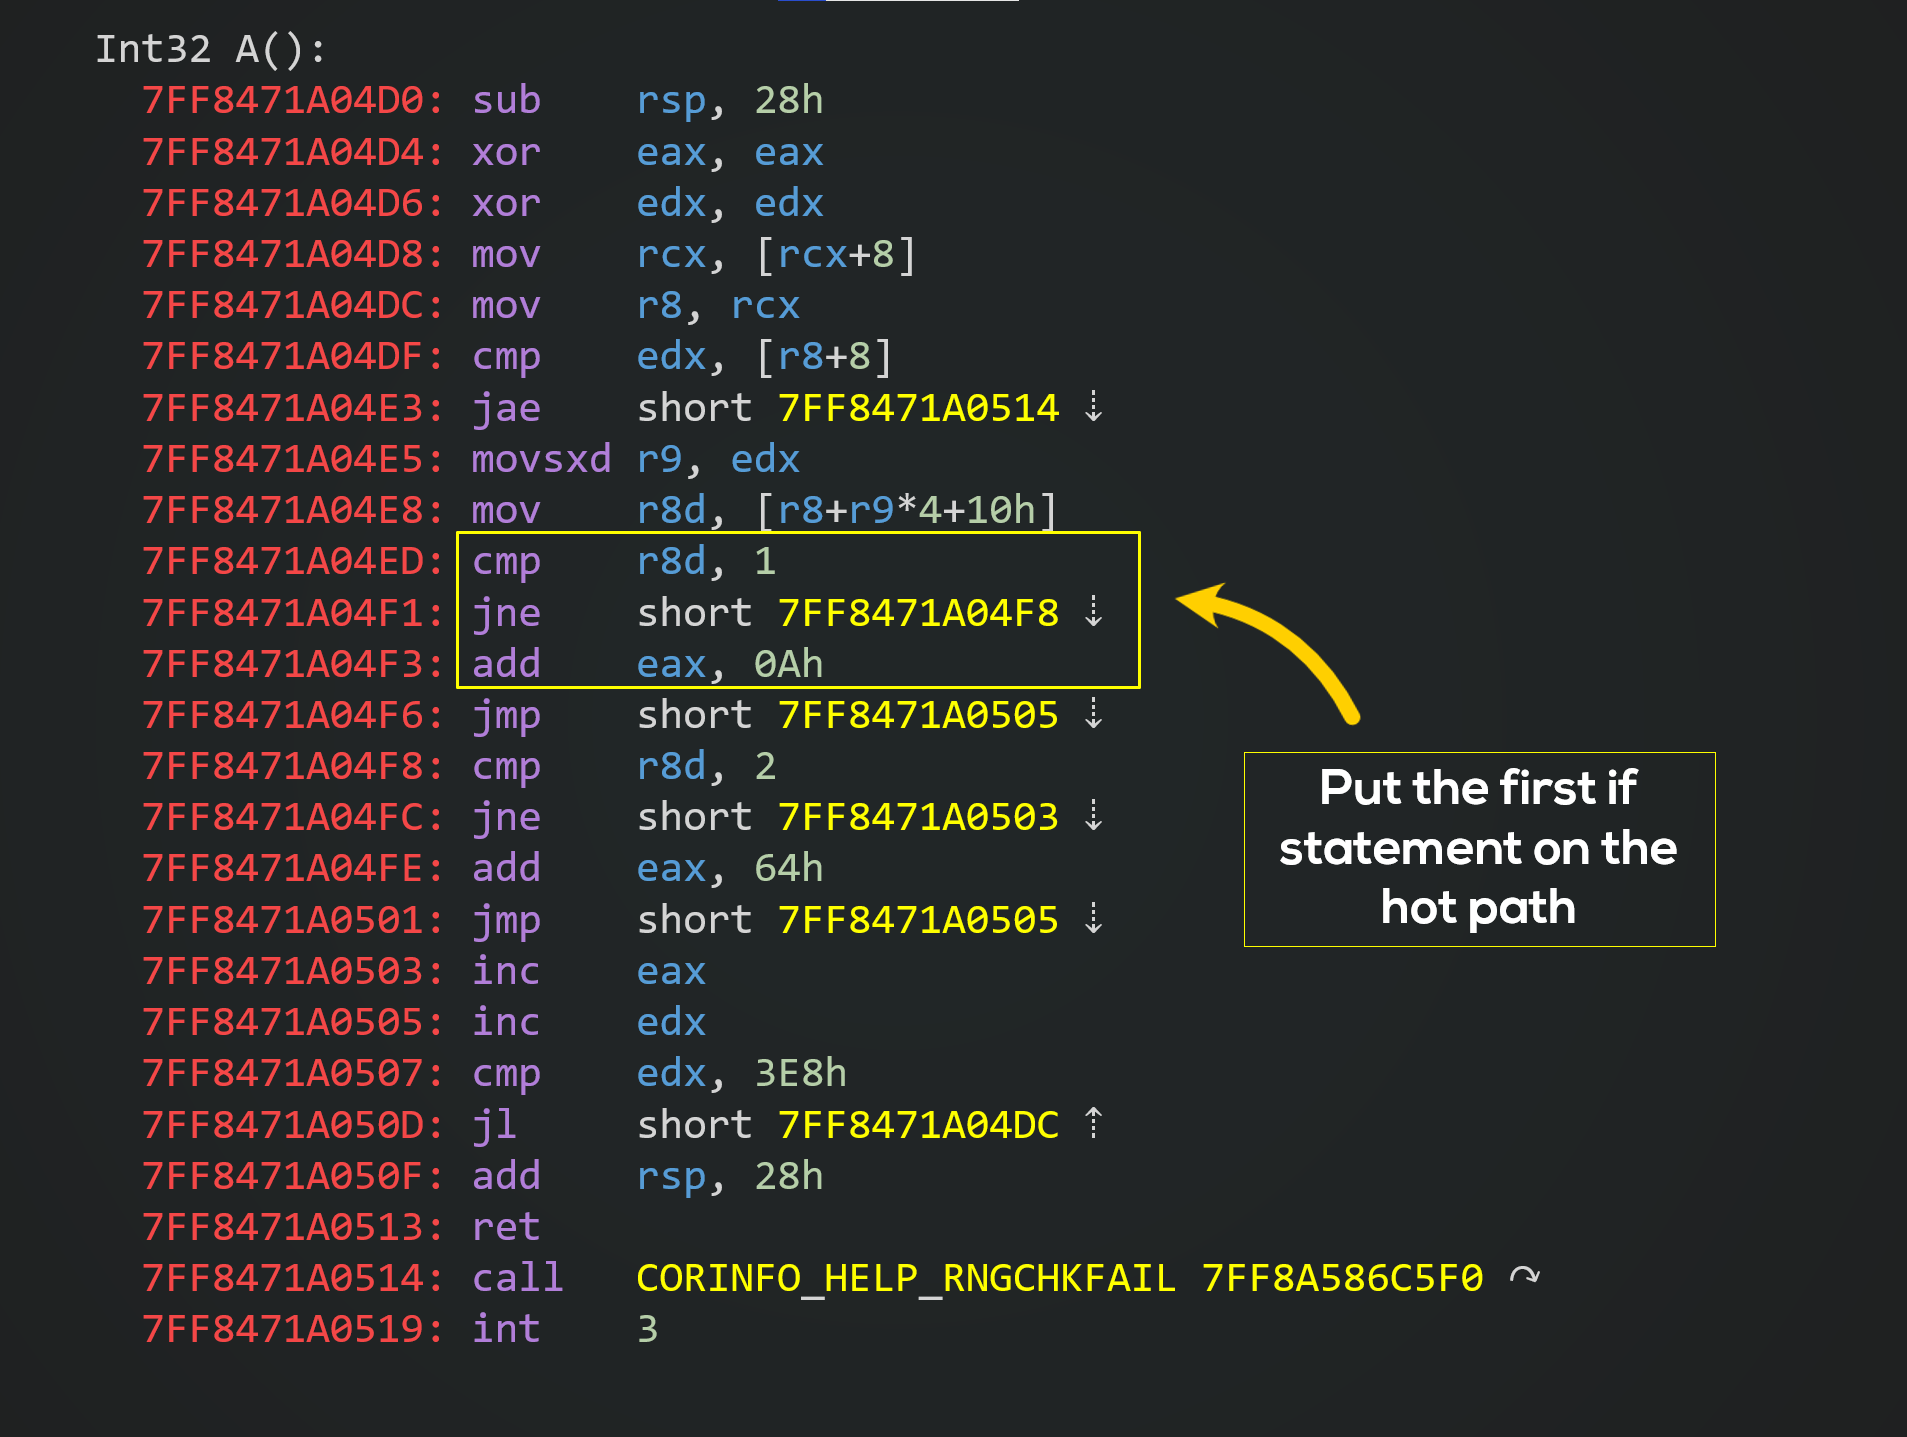
Here's the native code for the method:
Lie #2:
Let's look at another example in which we shall run the same code in a single benchmark:
Here's the result:
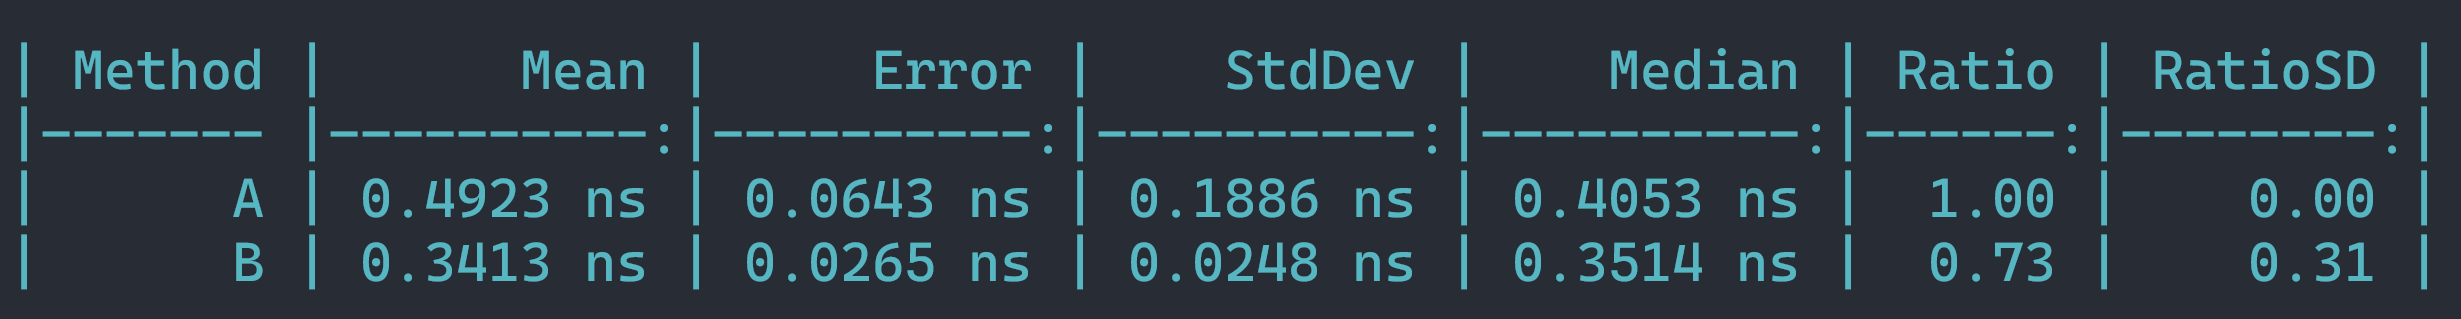
It turns out that one of the methods is ~30% faster than the other.
What happened here?
The answer is rather simple; Look at the mean of both methods. It's less than a single nanosecond.
Modern CPUs can issue multiple instructions per cycle depending on instruction and whether the instruction can run parallel. We also can have more than one cycle per nanosecond. However, this code has ~18 instructions, not to mention that setting up the method and running it also has a cost (measured in cycles). So in this situation, it's very easy to measure noise (which is what's happening here). If we rerun it, we might get a completely different result.
If I wanted to trick you, I would run it many times to get the result that would suit my case.
To fix this let's increase the size of the data slightly and see how it performs:
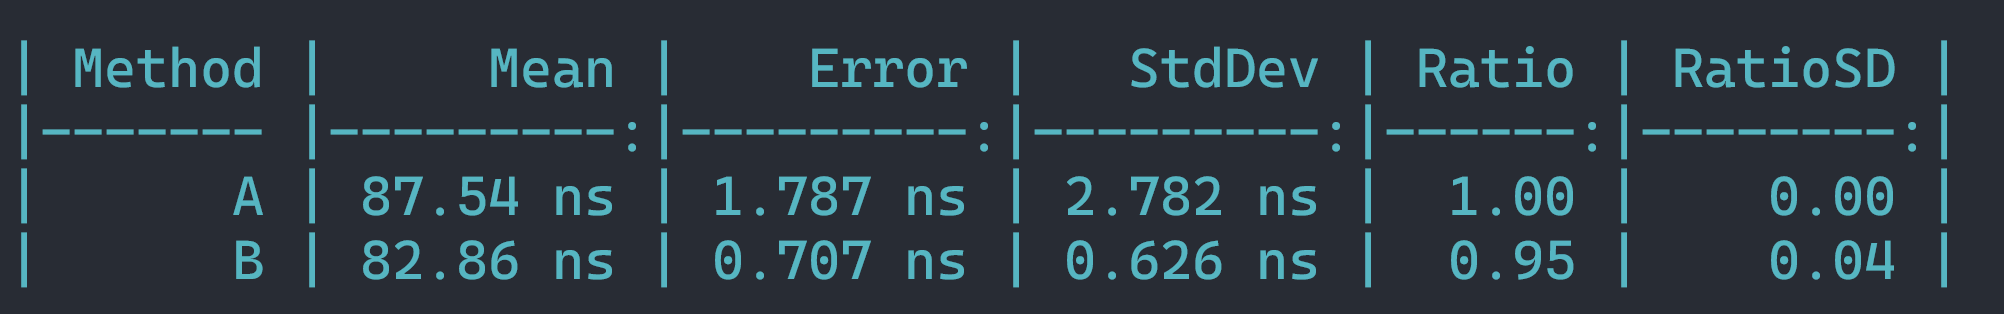
Now we got a 5% performance difference, which is better, but still there's a tiny bit of variability, even for the same code, but this is within reason.
If we ran it on a slightly bigger sample, the difference would go down again.
Pay attention to Mean and Error metrics (If Error >= Mean, the result is garbage) since it's easy to miss this (I have done it myself) and draw incorrect conclusions.
Lie #3:
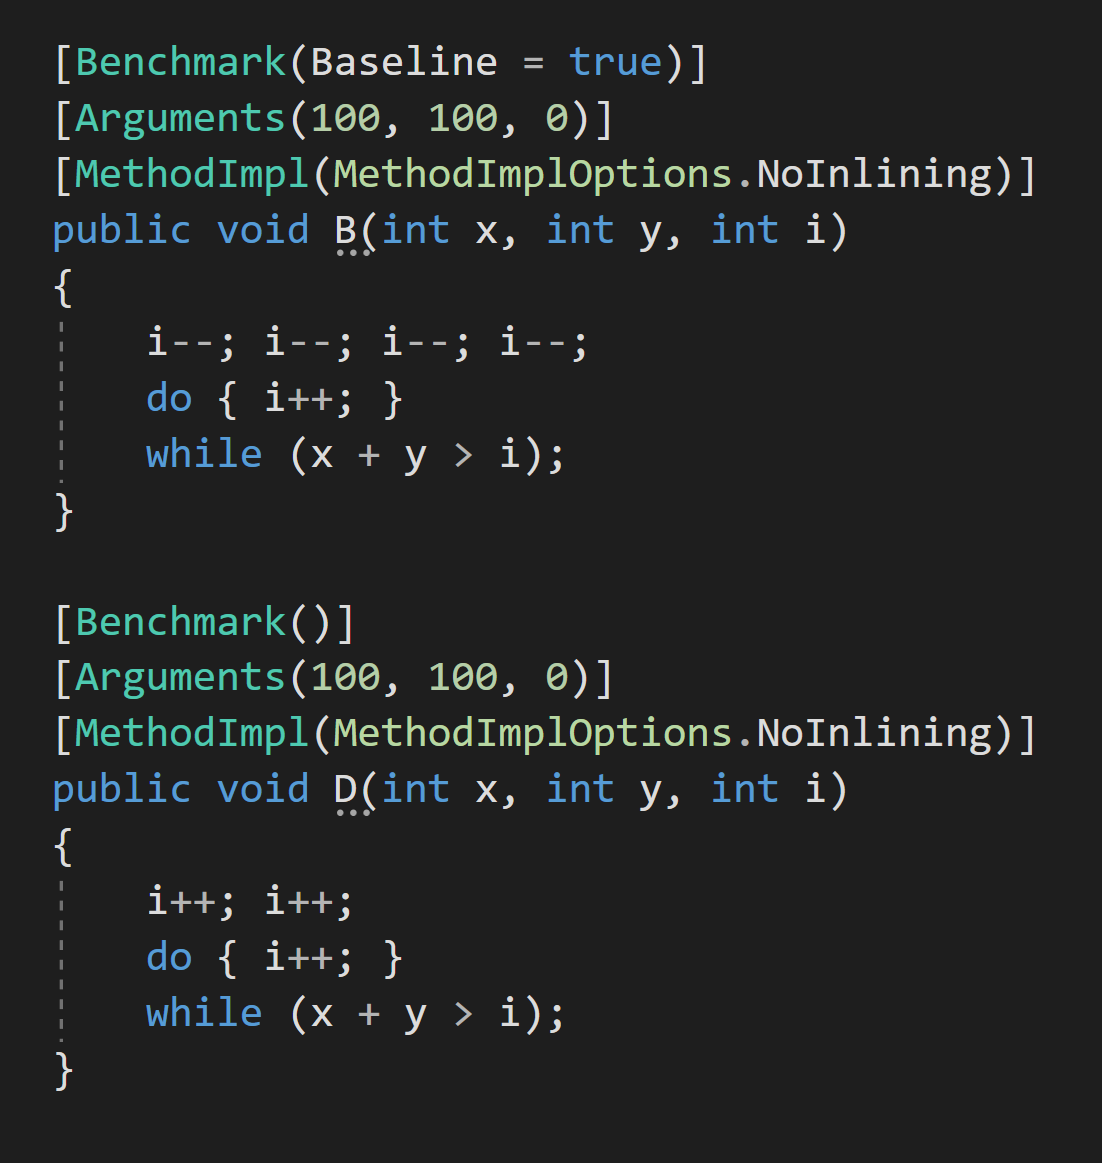
Consider the following code:
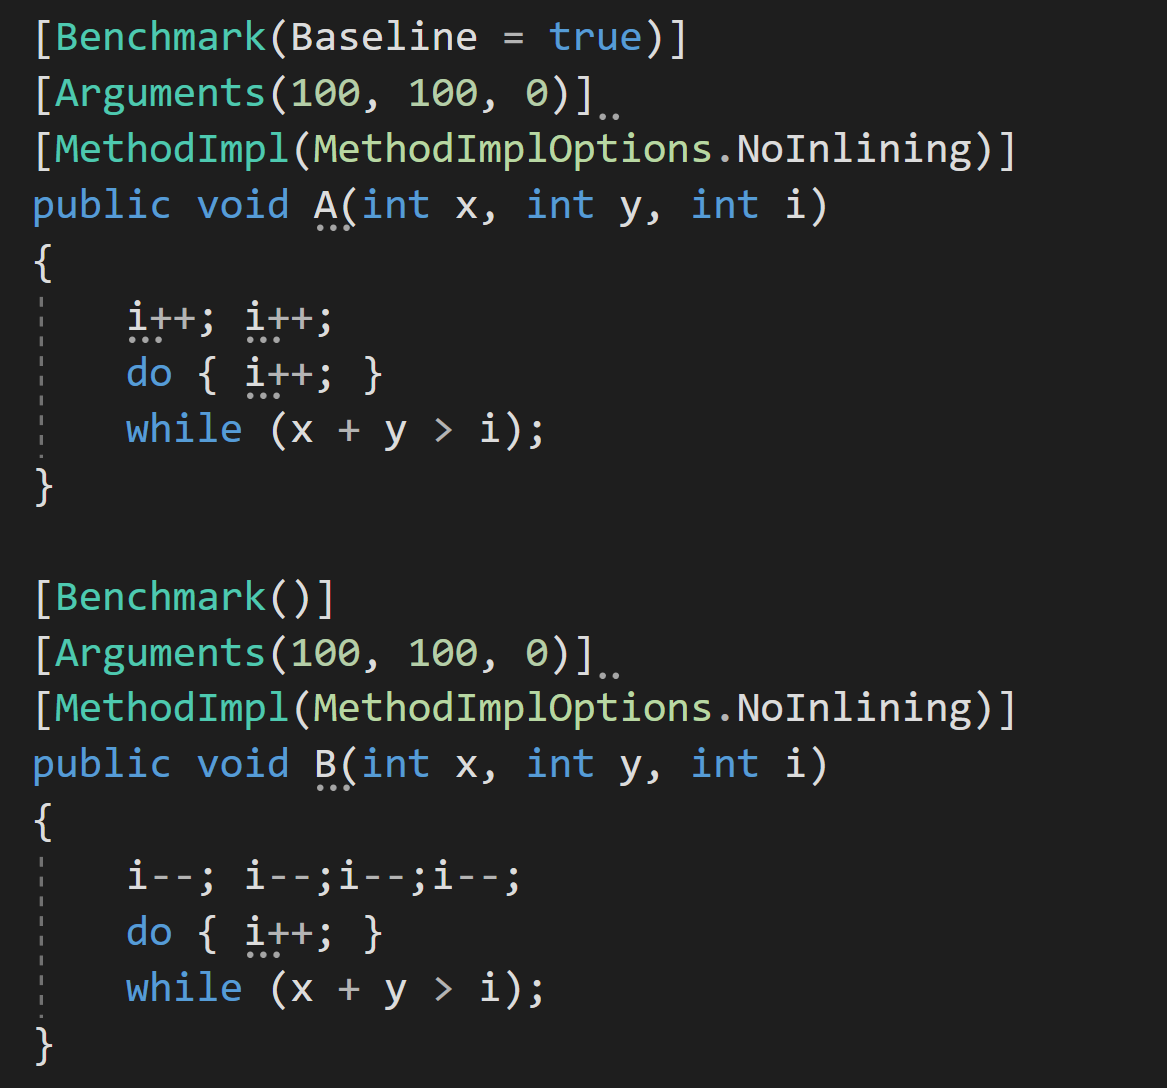
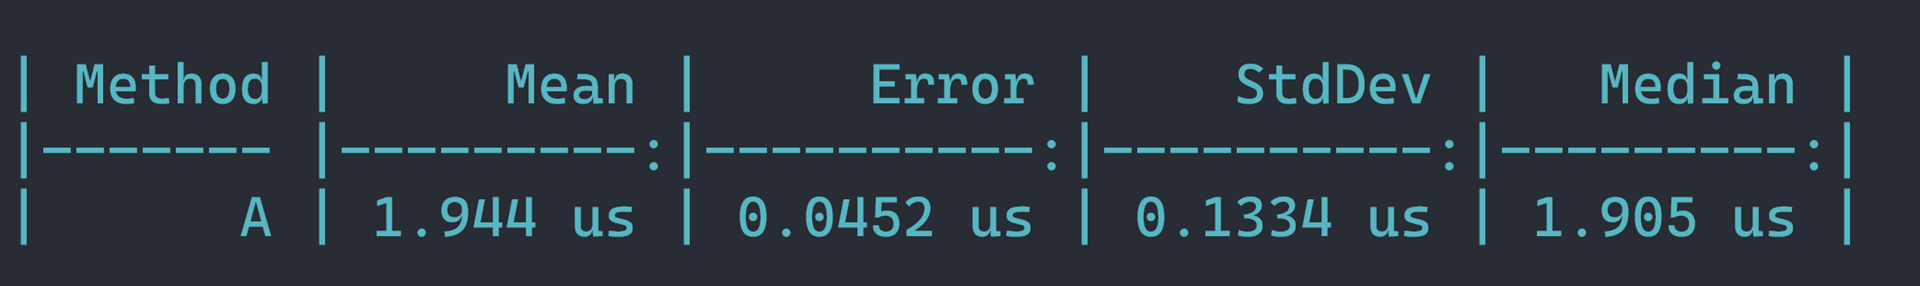
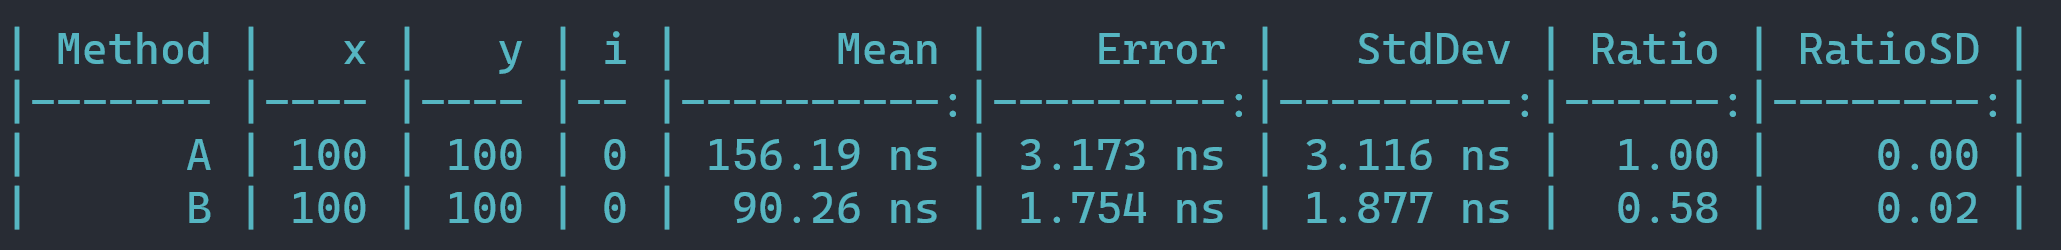
If we run it, it turns out that A is almost 2x times slower than B, and if you look closely, B has more iterations to do (since we decremented i a bunch of times before we entered the loop)
Before we move on to an explanation, I have to make a very important note:
This lie might not work on all CPUs, and it's because of how the newer CPUs handle things like Inc instructions to the same register; there are ways to make this problem universal, but I don't have AMD CPUs to find an example that will break everywhere. Rest assured that with enough benchmarks in .NET / GO / Rust / C++ and other compilers, you will have this problem and draw incorrect conclusions from it.
All the code that you saw so far was compiled on I7 Skylake
So what happens here? Code misalignment, more specifically loop code misalignment, I have a full article about this very topic when doing Benchmarks with GO:

TLDR; In GO, a good way to know if you have this problem is to swap methods around in code, and the compiler will build them in a different order, and there's a good chance that performance will also swamp or be completely different.
Not the case here however:
Alright, it's magic time:

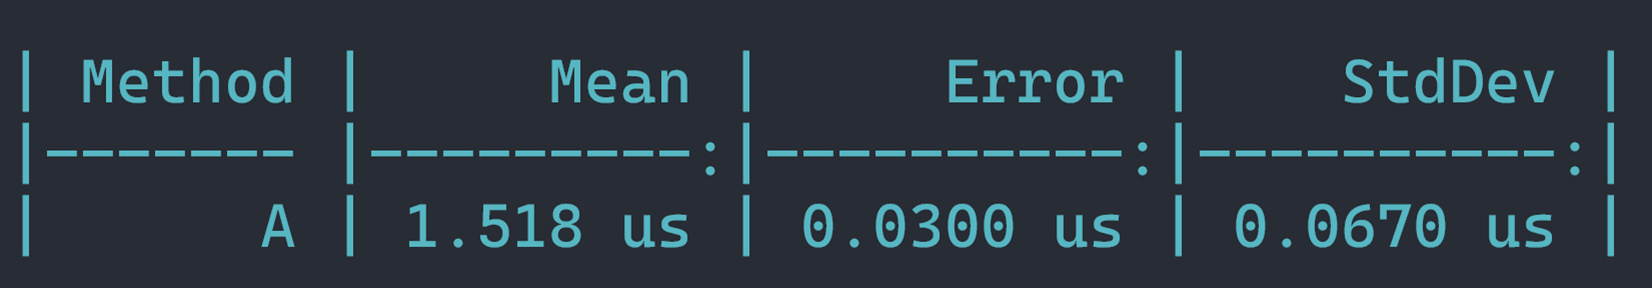
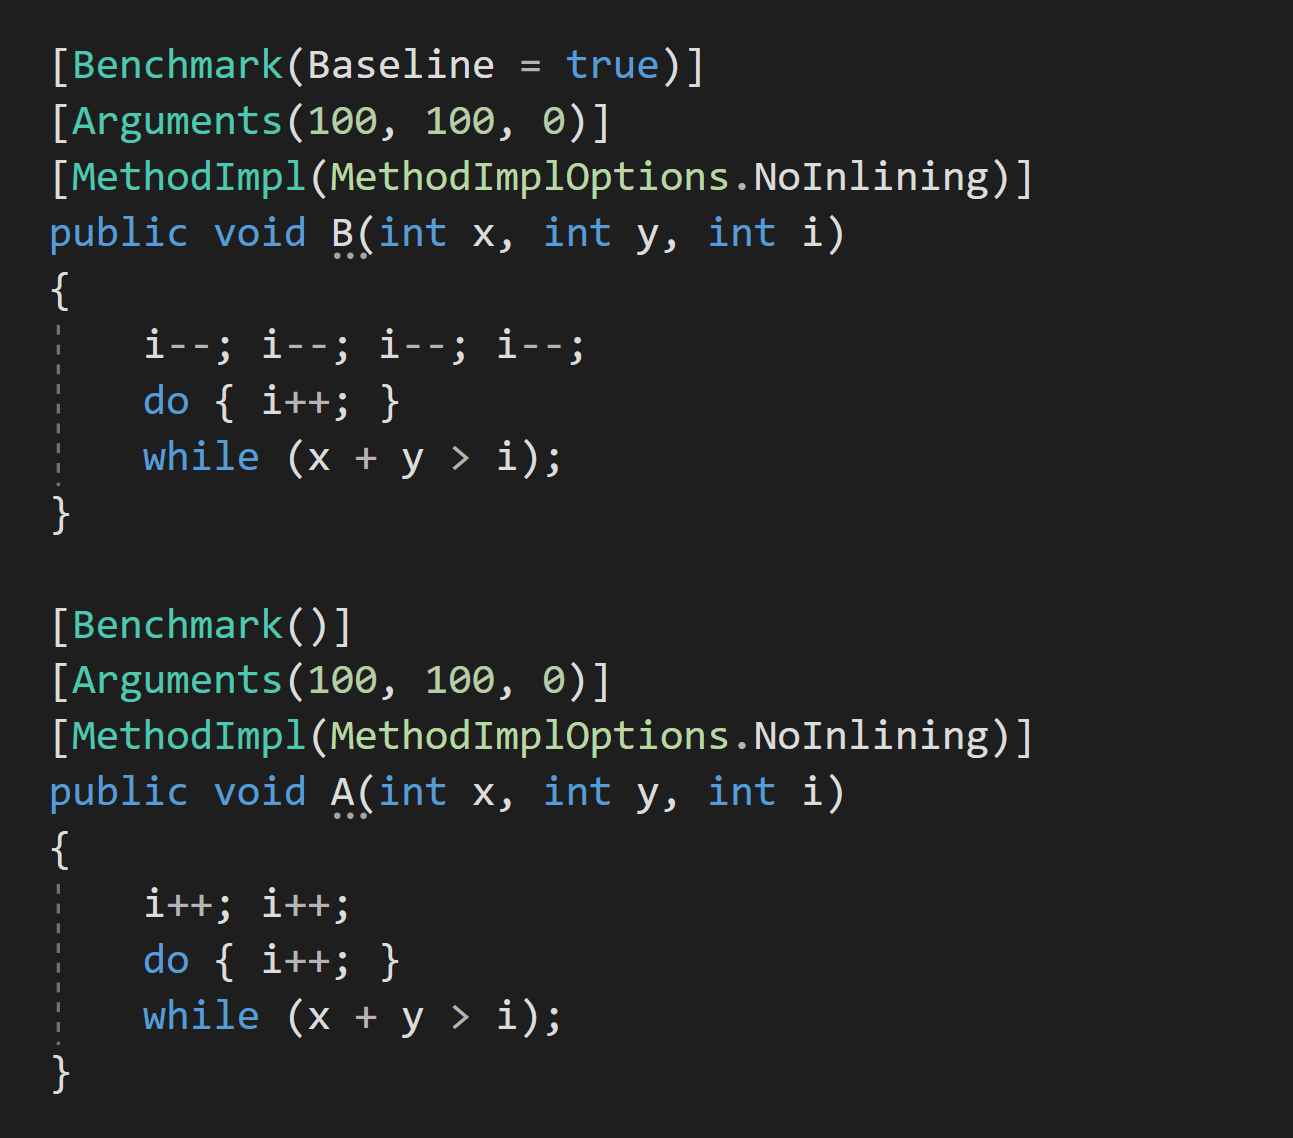
Let's make a small change and rename the method "A" to "D" and run it.
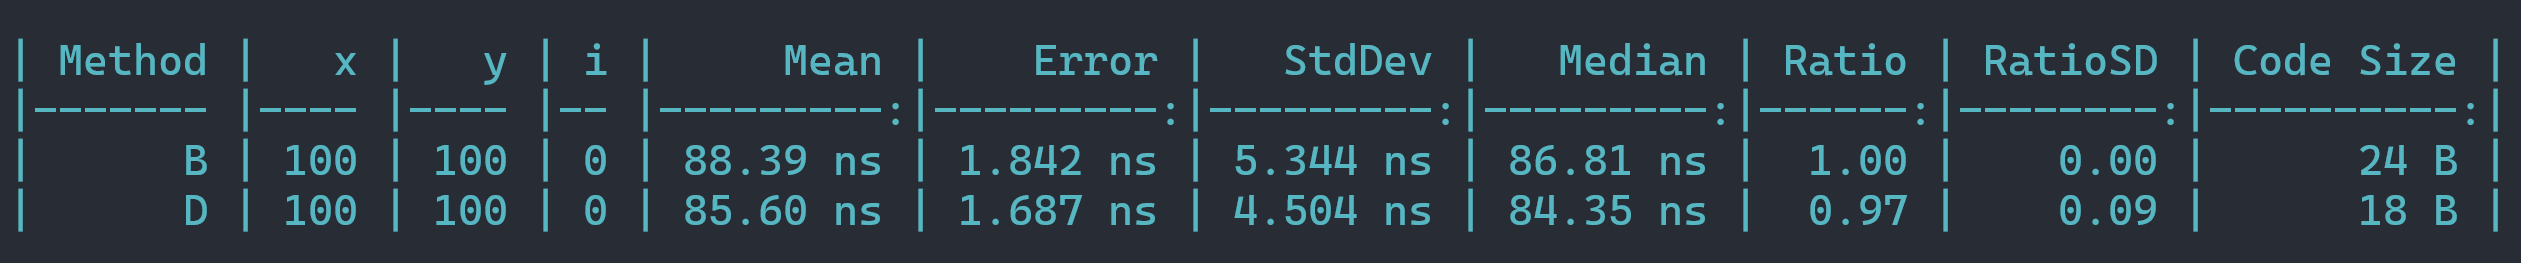
Now why is this happening?
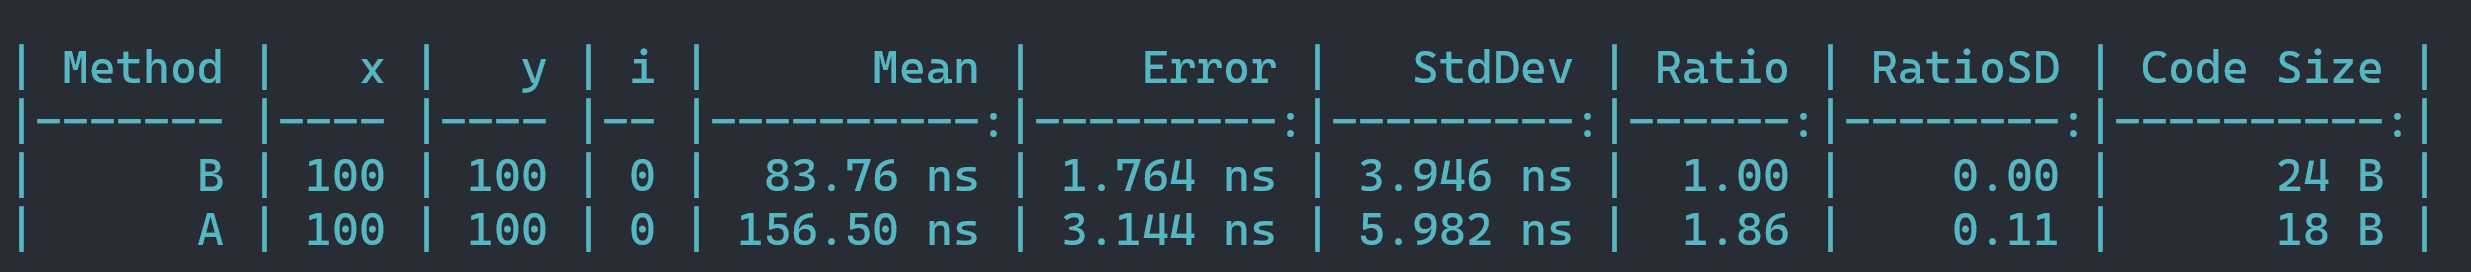
For some reason, if we change the name, the addresses of methods change, and they begin to be aligned again. In this specific case, it could be an issue with Benchmark.NET that we're using since the performance changes from version to version, and on top of that, if we roll our own simple benchmark code, we will see that the compilation order is critical for performance:
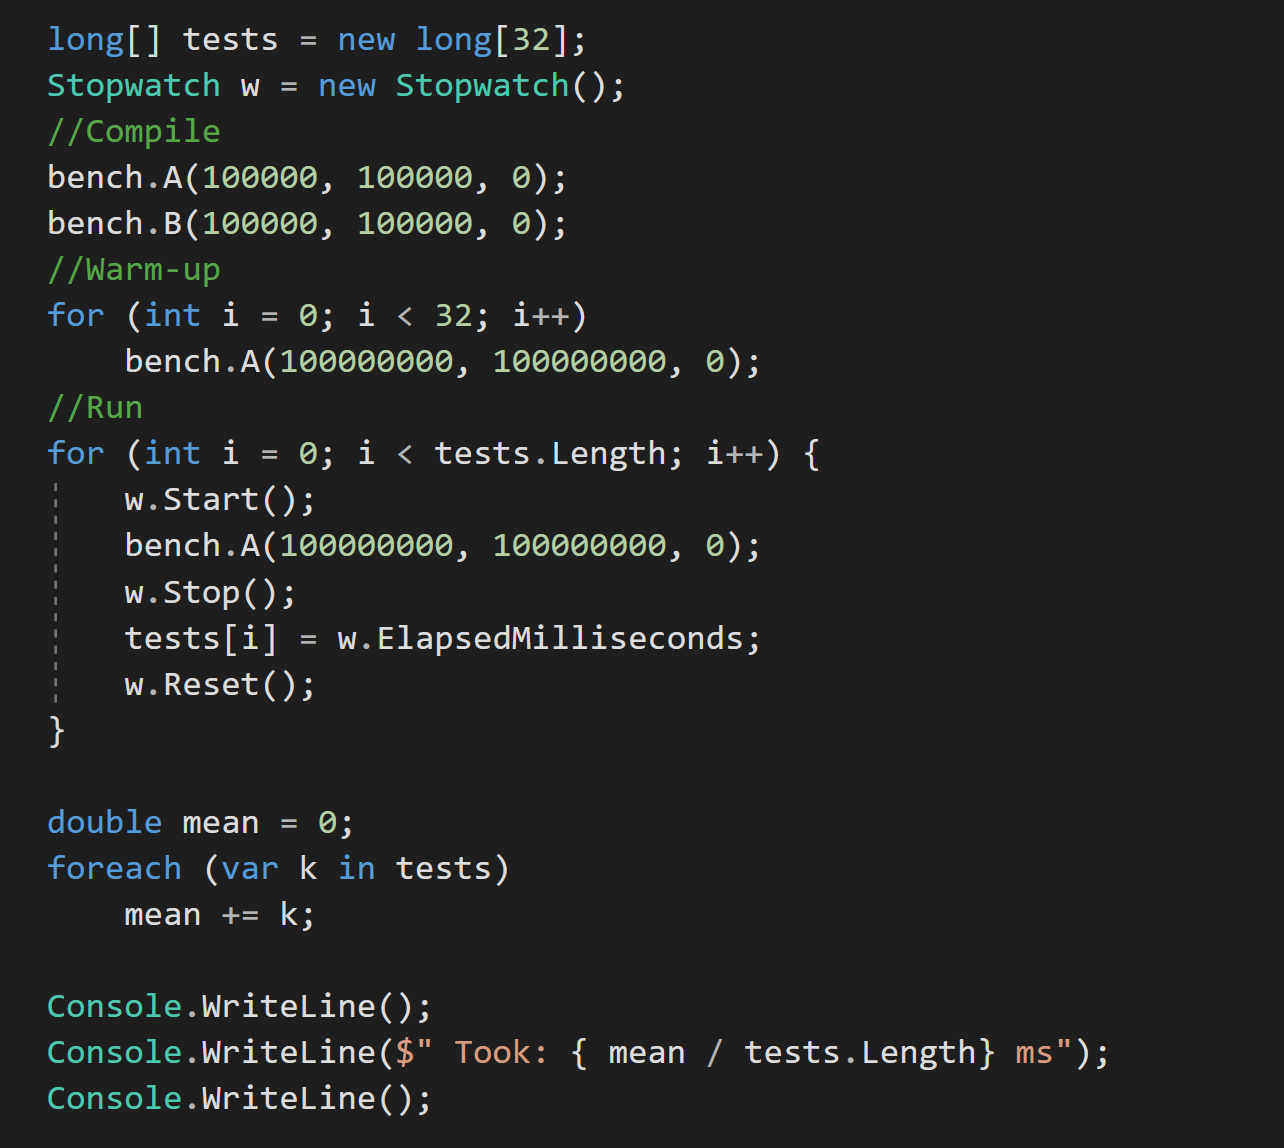
Let's roll our own dumb benchmark code.
This is by no means ideal, but it will do for now (Remember that we are testing the performance of A).
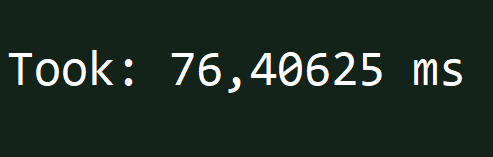
A compiled before B:
B compiled before A:
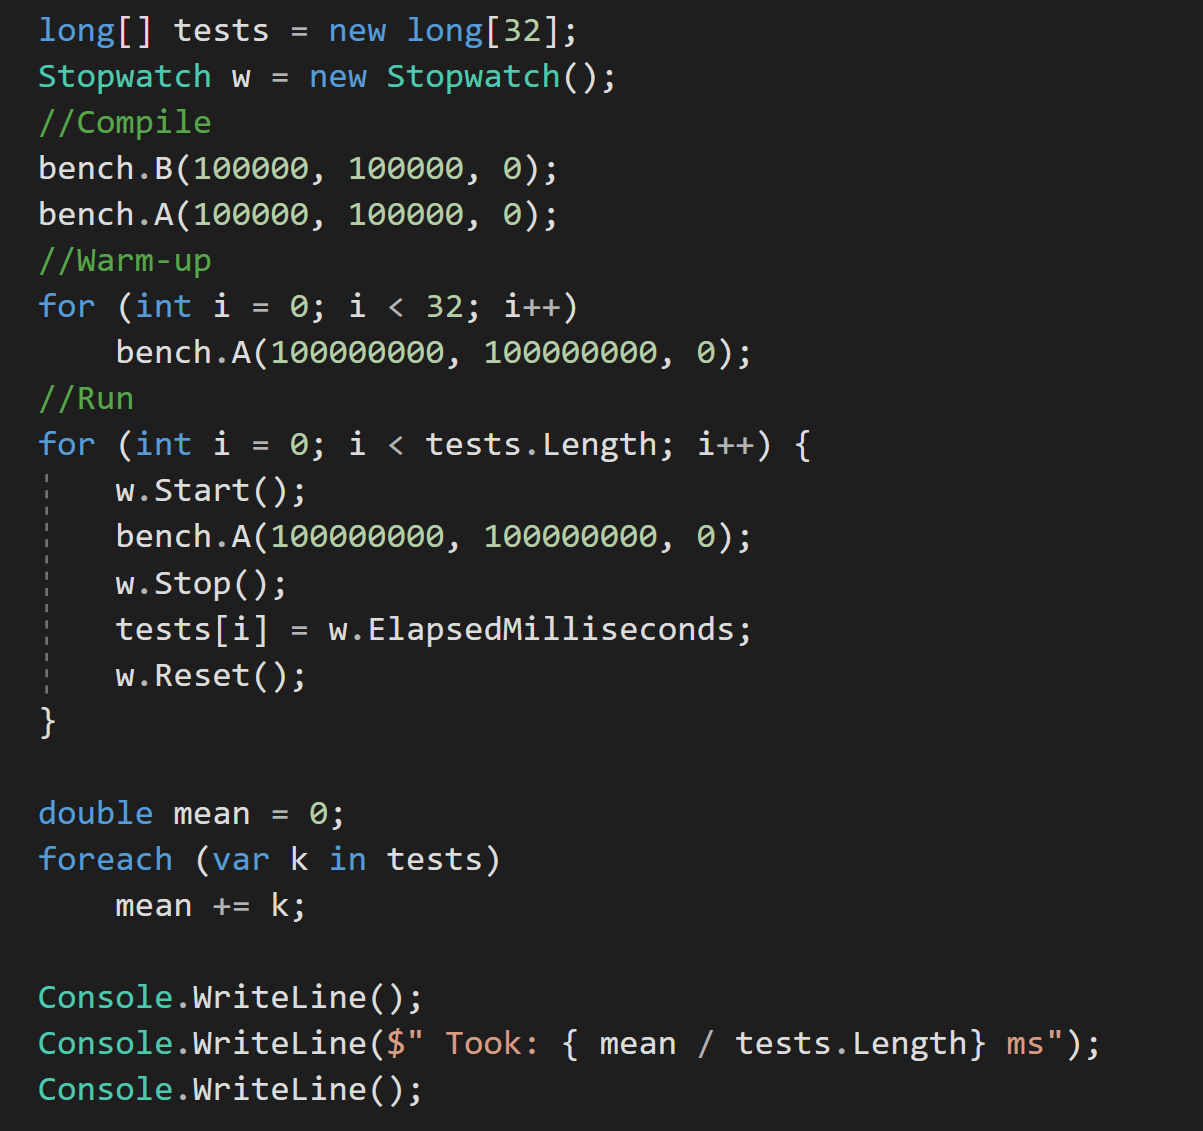

If we test A and B in isolation, our performance also matches expectations:
- A is misaligned and takes ~150ms.
- B is aligned and takes ~80ms.
Changing names does not help in any way.
Now that we have a general idea of how alignment can make our code look awesome and other code look terrible by comparison. Armed with this knowledge we can really go to town. The good thing is that if the loop is doing something complicated, the effects of misalignment are minimized (provided that you don't have multiple misalignment problems happening at the same time)
Imagine if we crafted code that uses all tricks simultaneously; we could be getting orders of magnitude in performance difference. In reality, we would never improve the code in any meaningful way.
Final Thoughts
If you reached this far, you might feel slightly depressed since performance benchmarking is very hard indeed, and everything looks broken. But don't worry, it's not all bad; there are positive things. Most of the time, you will be doing benchmarks that do make sense, and they will not misbehave in weird ways. You will now be better prepared to assess low-level libraries that claim super-duper performance that you might want to use in your project or write yourself.
This concludes the first part of this article. In the next part, we will focus on weaponizing Tiered Compilation, Debug Symbols, Static Branch Elimination, and more.
It's going to be Epic!
Stay Tuned.